Statistics
Statistics comprises quantitative summaries of data and the mathematical methods used to collect, analyze, interpret, and draw conclusions from observations.

Grokking Statistics
The discipline of collecting, analyzing, interpreting, and reasoning from data to describe phenomena and infer broader conclusions.
- How it is used
- Supports data-informed decisions, predictions, product evaluation, and critical assessment of claims under uncertainty.
- How deep it goes
- Introduces a four-stage analysis workflow and applications while deferring detailed methods to topics such as testing and regression.
- Examples
- Uses inventory planning, airline fares, promotions, uptime, product defects, and everyday questions about commuting and bedtime.
- What you can do after
- Evaluate/understand data-based claims, formulate questions, and choose evidence-oriented measures for practical decisions.
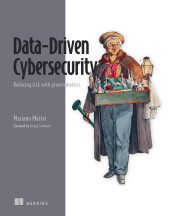
Data-Driven Cybersecurity
Statistical analysis is the application of statistical methods to summarize data, evaluate relationships, and draw conclusions under uncertainty.
- How it is used
- Turns security metrics into evidence for detecting anomalies, assessing risk, evaluating defenses, and guiding business decisions.
- How deep it goes
- Explains practical methods through security scenarios and accessible Python examples, without requiring hand calculations or advanced mathematics.
- Examples
- Uses login patterns, phishing trends, detection-rate comparisons, throughput alerts, and a chart of monthly exploit counts.
- What you can do after
- Apply it via Python libraries to analyze security metrics and interpret results for prioritization and leadership decisions.

Modern C
- How it is used
- Uses statistics to assess repeated timings and support performance improvement claims.
- How deep it goes
- Works through timing summaries and a C accumulator that collects moments through the third, including reporting mean and relative standard deviation.
- Examples
- Uses twenty fictive timings, a frequency histogram, and repeated C loop timings to illustrate variation and collection.
- What you can do after
- Evaluate timing variability and interpret performance claims alongside measurement effects.

Statistics Every Programmer Needs
A statistical method is a formal procedure for analyzing data, quantifying uncertainty, or drawing conclusions from observations.
- How it is used
- Supports pattern discovery, uncertainty assessment, inference, forecasting, and structured decisions across practical domains.
- How deep it goes
- Defines statistical reasoning and connects it to implementation, with regression assumptions and evaluation treated more concretely than other methods.
- Examples
- Uses regression analysis, Monte Carlo simulation, project prioritization, resource allocation, stock forecasting, and customer-behavior modeling.
- What you can do after
- Apply statistical methods in Python, validate assumptions, interpret results, and support decisions with quantified evidence.
Read how Statistics Every Programmer Needs explains statistics →

Outlier Detection in Python
A data-analysis technique that uses statistical properties such as location and dispersion to identify unusual values.
- How it is used
- Uses simple distribution summaries to screen columns for extreme values before or instead of broader outlier detection.
- How deep it goes
- Explains z-scores, IQR, IDR, MAD, histograms, KDE, kthNN, and frequency scoring, but remains primarily univariate.
- Examples
- Uses staff-expense amounts, numeric columns, categorical frequencies, and univariate tests as practical detection examples.
- What you can do after
- Diagnose outliers with z-scores, IQR, IDR, MAD, density, neighbor, and frequency-based tests.
Also covered in
- 100 SQL Server Mistakes and How to Avoid Them
- PostgreSQL Mistakes and How to Avoid Them
- The Well-Grounded Data Analyst
- Grokking Data Structures
- Cyber Threat Hunting
- Learn Haskell by Example
- Data for All
- DuckDB in Action
- Machines that ThinkIn early access (MEAP)
What to know first
- PythonPython is a high-level, general-purpose, dynamically typed programming language with readable syntax and support for multiple programming paradigms.
- SQLSQL is a standardized declarative language for defining, querying, and manipulating data in relational database systems.
- language modelA language model is a computational model that represents patterns in linguistic sequences to assign probabilities, predict, generate, or evaluate language.
- machine learningMachine learning is a field of computational methods in which systems learn patterns or relationships from data to make predictions, decisions, or other outputs.
Related concepts
- rule-based systemcontrasts with · A rule-based system is a computational system whose behavior or outputs are determined by applying explicitly specified rules to inputs, facts, or conditions.
- descriptive statisticsincludes · Descriptive statistics are numerical or graphical methods for summarizing and characterizing observed data without making inferences beyond those data.
- datauses · Data is recorded or represented information, observations, measurements, or values that can be stored, processed, communicated, or interpreted.
- machine learningcontrasts with · Machine learning is a field of computational methods in which systems learn patterns or relationships from data to make predictions, decisions, or other outputs.
Questions about statistics
What is statistics?
Statistics comprises quantitative summaries of data and the mathematical methods used to collect, analyze, interpret, and draw conclusions from observations.
Which Manning books explain statistics?
Grokking Statistics, Data-Driven Cybersecurity, Modern C, Statistics Every Programmer Needs and Outlier Detection in Python.
What should I know before learning statistics?
Manning books that teach statistics usually introduce Python, SQL, language model and machine learning first.
What is the difference between statistics and rule-based system?
Statistics comprises quantitative summaries of data and the mathematical methods used to collect, analyze, interpret, and draw conclusions from observations. A rule-based system is a computational system whose behavior or outputs are determined by applying explicitly specified rules to inputs, facts, or conditions.
What kinds of statistics are there?
Kinds of statistics include descriptive statistics.
These guides are generated from the text of Manning books by Manning's knowledge graph and link to the sections they draw on. The full books are available on liveBook and at manning.com.