A statistical sample is a subset of observations collected or selected to learn about a larger population. Because it may not represent the population perfectly, conclusions based on it include uncertainty. section 3.4 section 3.4.1
Estimating customer spending
Surveying every customer may be impractical, so randomly selecting 100 customers creates a sample. If their average monthly spending is $200, a 95% confidence interval might range from $180 to $220, expressing uncertainty about the population average. section 3.4.1
Interpret a sample by checking:
- Whether the sample represents the population well enough for the intended decision. section 3.4.1
- How sample size, confidence level, and inherent data variability affect confidence-interval width. section 4.8
- Whether the dataset is a sample or complete population data: estimate the former, but calculate the latter’s average. section 4.8
Figure 4.6 Confidence intervals for (a) average sales price and (b) average review scores, for transactions in the “health and beauty” category of products
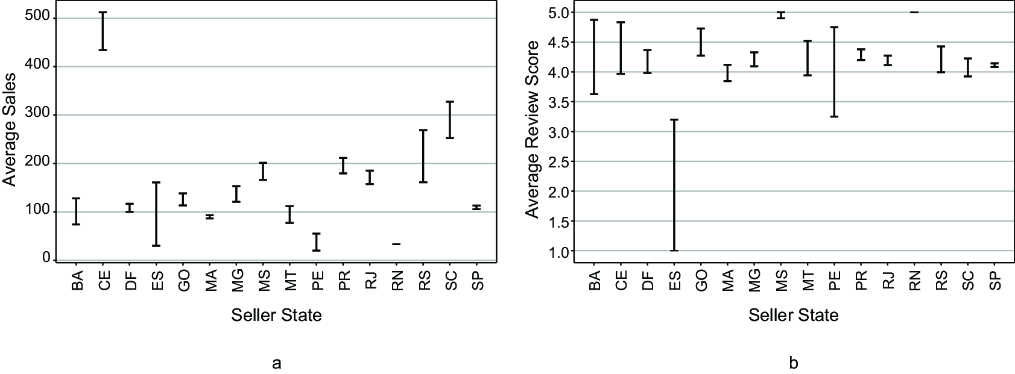
Compare interval widths for average sales prices and review scores while judging what the samples support. section 4.8






