liveBook · Manning

Student's t-distribution

As explained in Time Series Forecasting Using Foundation Models

Student's t-distribution is a probability distribution with heavier tails than a normal distribution, commonly used when estimating uncertain quantities from limited data.

Student's t-distribution models uncertain future values with three parameters: degrees of freedom, mean, and scale. Increasing degrees of freedom reduces extreme-value probability and makes the distribution more like a normal distribution. section 4.1.1

In probabilistic forecasting, a distribution head outputs these parameters so the model can construct prediction intervals directly. The choice favors simplicity over more expressive distributions that are harder to train and optimize. section 4.1.1 section 4.1.2

Lag-Llama forecasting

Lag-Llama assumes a Student's t-distribution for predictions, using past series values and date-time features to forecast future values. section 4.1.2

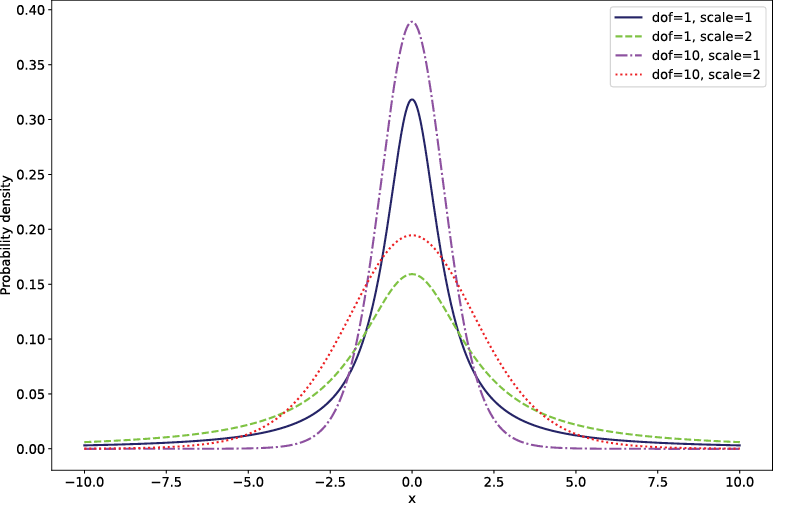
Figure 4.3 Student’s t-distribution with varying scales and degrees of freedom. More degrees of freedom result in a lower peak, while the scale (also called the standard deviation) widens the peak and increases its value.
A diagram of a normal distribution

AI-generated content may be incorrect.

Compare how scale and degrees of freedom change the distribution's spread and shape. section 4.1.1


How Time Series Forecasting Using Foundation Models covers it

How deep it goes
Explains three parameters and their shape effects, but stops short of formal derivation or estimation procedures.
Examples
Uses Lag-Llama's distribution head and a figure varying scale and degrees of freedom.
What you can do after
Evaluate how a forecasting model represents uncertainty and produces prediction intervals.
How it connects
Connects distribution heads, probabilistic forecasting, prediction intervals, normal distributions, and transformer-based forecasting.

Also explained in

Compare how 2 books explain student's t-distribution →

Related concepts

This explainer was generated by Manning's knowledge graph from the text of Time Series Forecasting Using Foundation Models. The section links point to the parts of the book it draws on.