The SVG path d attribute, meaning “draw,” defines a path’s geometry as a sequence of commands and coordinates. It tells the browser where drawing starts, how the path changes direction, and whether it remains open or closes. Paths handle complex shapes and curves that SVG primitives such as lines, rectangles, circles, and ellipses cannot express directly. section 1.2.2 section 4.0
A path string can become long quickly because it must encode endpoints and curve instructions. In D3 visualizations, shape generators usually produce this value instead of requiring manual path writing. section 4.0
A curved path
This path starts with M at 680,150, then uses C and S curve commands to create a flowing purple line. Setting fill to none leaves only the stroked curve visible. <path d="M680 150 C 710 80, 725 80, 755 150 S 810 220, 840 150" fill="none" stroke="#773b9a" stroke-width="3" /> section 1.2.2
Path data is especially useful for visualization shapes such as:
- Lines and curves in line charts. section 4.0
- Arcs in donut charts. section 4.0
- Custom complex forms beyond SVG primitive shapes. section 1.2.2
Figure 4.1 Project that we’ll build in this chapter: a line chart of the temperature evolution in New York City in 2021 and a set of arcs showing the percentage of days with precipitation
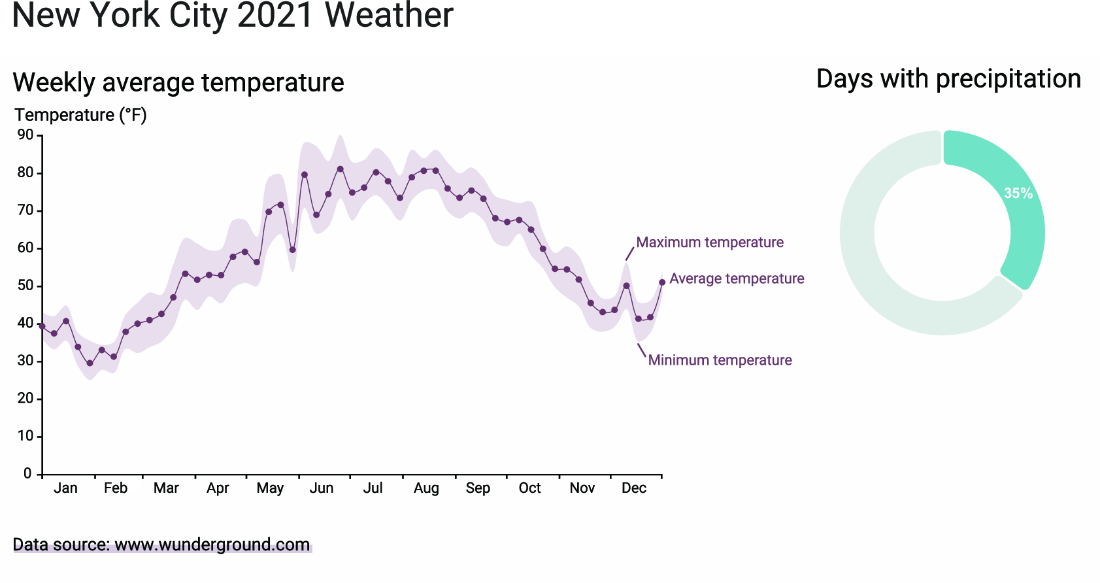
A temperature line chart and precipitation arcs show two common results of generating SVG path data for a visualization. section 4.0
