Synthetic data is generated rather than collected as an observation. In outlier detection, its intended role matters: generated records may represent clean, typical inliers or deliberately unusual cases. Controlled data makes detector behavior easier to inspect, but results on it do not automatically carry over to real data. section 11.1.1 section 3.2.1
Three uses call for different generated records:
- Understand a detector: start with simple two-dimensional data, then, if useful, model cleaner inliers resembling the real data and add known outliers. Inspect scores, preprocessing effects, and parameter changes before relying on real-data results. section 11.1 section 11.1.1
- Tune and test: generate likely outliers, score them alongside real records, and check whether they rank higher. Doping modifies particular real rows; newly generated data follows general patterns without corresponding to particular rows. Use varied types and difficulty levels rather than one easy test set. section 11.2 section 11.6
- Train a classifier-based detector: distinguish real records from generated ones, as in Real versus Fake detection or distance metric learning. A Real versus Fake example samples each feature from a normal distribution fitted to the real column, then trains a decision tree to separate the two sets. section 11.0 section 3.2.5
For new tabular data, generating each feature independently is simple and controllable. A fitted normal distribution, histogram, or kernel density estimate can reproduce a column’s values, but independent sampling discards relationships between columns. Generating features in sequence and predicting each from earlier features can preserve more of those relationships. Gaussian mixture models can instead sample typical joint patterns; changing their covariance matrices produces a wider range containing a larger proportion of likely outliers. Simulations offer another route, particularly for unusual sequences, but take more work to set up. section 11.2.2 section 11.2.3 section 11.6
Figure 11.2 The distribution of At_bats is shown in the left pane for both the real and synthetic data. The distributions are almost identical. The middle pane shows the joint distribution of At_bats and RBIs in the real data, and the right pane shows the same two features in the synthetic data. The relationship between these features is not maintained in the synthetic data.
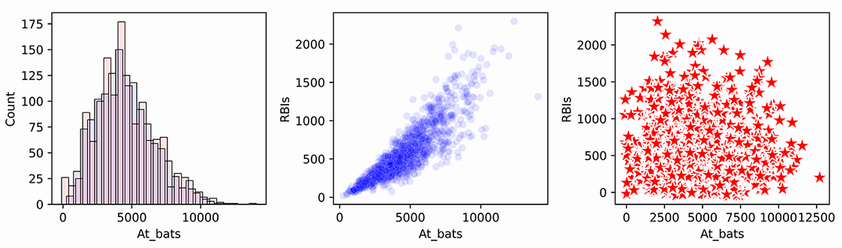
The baseball comparison separates two checks that are easy to confuse: synthetic At_bats values match the real feature’s distribution, while their relationship with RBIs is lost. section 11.2.2
Known generation labels make evaluation possible, not certain: real data can contain outliers, and some generated records can be ordinary. Metrics such as AUROC assess whether assumed outliers receive higher scores; precision at k is relevant when only the top k records will be inspected. A clean synthetic-inlier set can also serve as training data, but an oversimplified model may miss legitimate real patterns. Treat such training as a cautious complement to detectors trained on real data. section 8.5.2 section 11.1.2