Telemetry is automatically collected information about service behavior, including metrics, logs, and traces. In a service mesh, proxies observe inbound and outbound traffic and forward this information to centralized monitoring systems without application changes. section 4.2 section 4.5.2
Telemetry supports several operational activities:
- Collect metrics and logs from Envoy proxies and TCP sessions, with customizable Istio metrics. section 4.3.4
- Trace distributed transactions, investigate latency, analyze service dependencies, and perform root-cause analysis. section 4.3.4
- Visualize service topology, health, performance, latency, errors, and traffic across microservices. section 4.5.2 section 5.1.5
- Support service-level indicators, service-level objectives, scaling decisions, optimization, and postmortems. section 4.5.2 section 5.1.5
Mesh telemetry path
A sidecar proxy attached to each Pod intercepts microservice traffic, collects metrics and logs, and sends them to Anthos Service Mesh, Google Cloud Monitoring, or Google Cloud Logging. Kiali can build a service graph from the resulting data, while Prometheus and Grafana support querying, visualization, and alerting. section 4.2 section 4.3.4 section 4.5.2
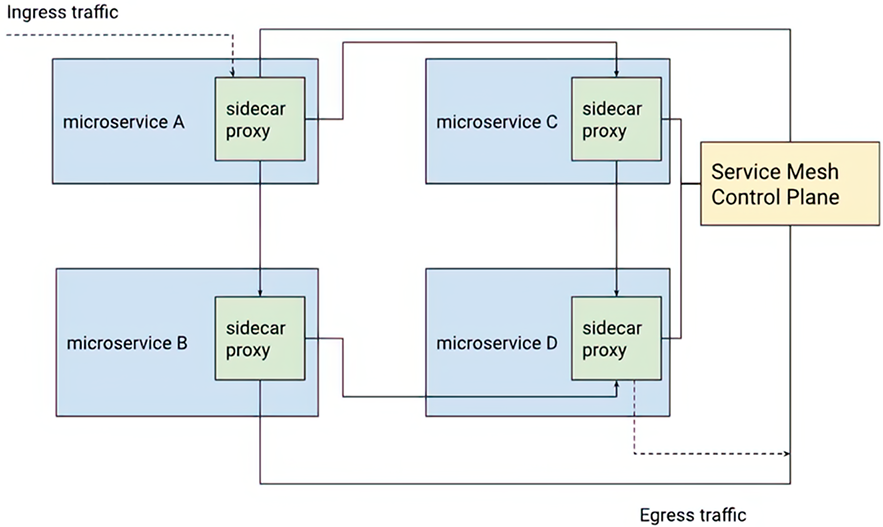
Use the sidecar architecture diagram to follow how a proxy shares a microservice’s lifecycle while running as a separate process. section 4.2







