Telemetry is machine-generated observability data describing software or infrastructure behavior. Its main forms are logs, metrics, and traces, which can be gathered, transformed, transmitted, aggregated, and analyzed across distributed systems. section 1.3.2
Telemetry participates in an operational data flow:
- Applications generate logs, metrics, and traces. section 1.3.2
- Collectors gather data from different sources and transform it into a common OTLP structure. section 1.3.2
- OTLP defines telemetry data structures, encoding, and transmission through gRPC with HTTP/2, Protocol Buffers, or JSON. section 1.3.2
- Exporters route telemetry to compatible collectors, observability services, or analysis tools. section 1.3.2
Figure 1.3 Fluent Bit’s relationship with OpenTelemetry with apps generating OTel logs, metrics, and traces and Fluent Bit facilitating their transmission to an OTel-compliant point of aggregation or processing. Applications can send OTLP data directly or via an OTel component, and we can route data to other OTel services or analysis tools.
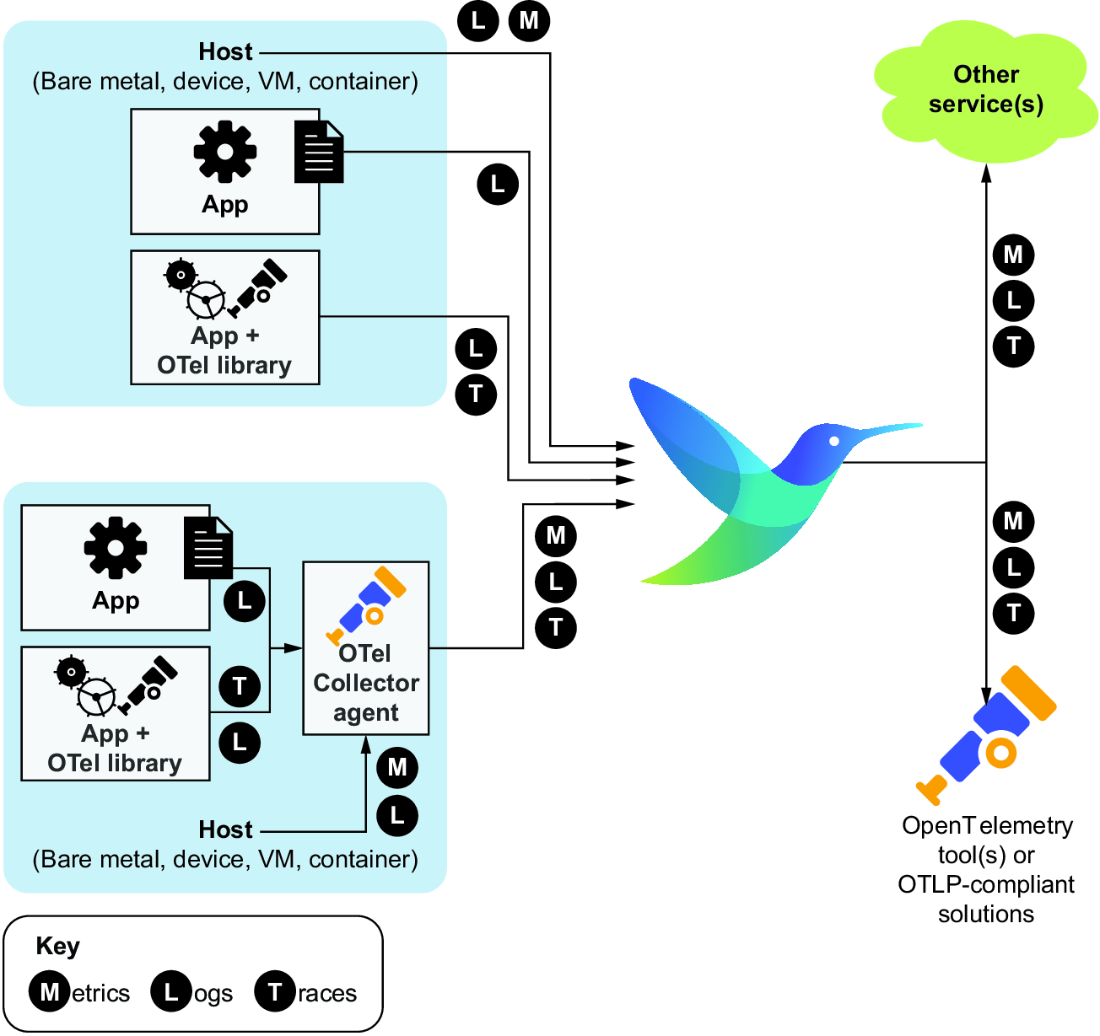
Trace the flow from applications producing logs, metrics, and traces through Fluent Bit to an OpenTelemetry-compatible aggregation or processing point. section 1.3.2







