Telemetry is data emitted by software about its execution, health, behavior, and user interactions. Logs, traces, and metrics turn application outputs into evidence about system state. section 11.1 section 11.7
Use each telemetry type for a different view of an API:
- Logs record specific events, such as received requests or raised errors. section 11.2
- Traces connect processing steps and their logs through a shared trace ID. section 11.2
- Metrics summarize behavior, such as request rates and response times, helping reveal trends and outliers. section 11.7
Telemetry supports reliability and security. Continuous analysis can shorten mean time to recovery, reveal threats or endpoint abuse, and provide an audit trail of who did what, where, and when. Useful telemetry must be collected, stored, and processed so that it supports investigation rather than merely accumulating data. section 11.1 section 11.3
Instrumenting a FastAPI endpoint
OpenTelemetry can autoinstrument a Python FastAPI application without changing application code. Running the instrumentation command with console exporters produces signals such as a span for GET /books, including its trace ID, timing, route, method, and status. Add manual instrumentation when custom security telemetry is needed, while removing sensitive data from logged input. section 11.3 section 11.7
Figure 11.1 By continuously analyzing our logs, we gain an understanding of the state of our system. In this example, we find that one endpoint is encountering an unusual error rate.
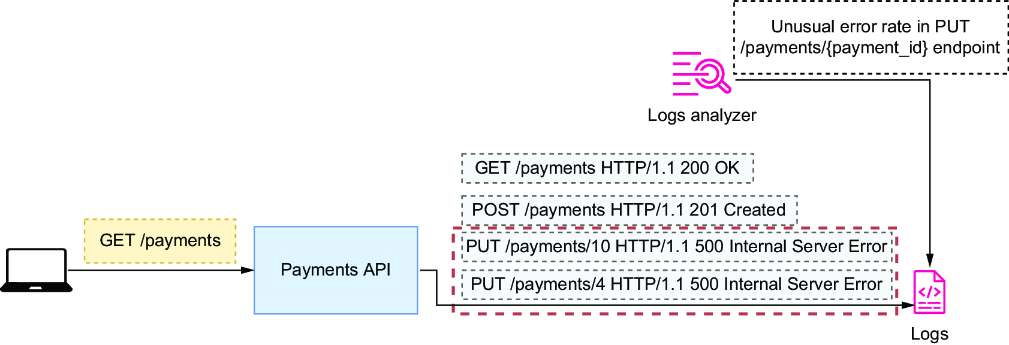
Use the observability diagram to see how continuously analyzing logs can expose an endpoint with an unusual error rate. section 11.1







