liveBook · Manning

Telemetry

As explained in Platform Engineering on Kubernetes

Telemetry is automatically generated data about software and system behavior, including metrics, logs, and traces.

Telemetry is automatically generated data about software and system behavior. In distributed applications, metrics, logs, and traces reveal whether services behave correctly and meet performance expectations. section 2.4 section 2.4.5

Use telemetry to answer two operational questions:

  • Is the application behaving correctly? Trace service calls and inspect application-level measures such as approved versus rejected proposals. section 2.4.5
  • Is the application performing acceptably? Monitor response times and determine whether services meet their Service Level Agreements. section 2.4.5
  • Centralize telemetry so teams can aggregate information, display dashboards, and reduce the cognitive load of operating distributed services. section 2.4.5

Operational dashboard

Instrument services with OpenTelemetry, send their metrics, logs, and traces to a central collection path, and use Prometheus and Grafana to build a dashboard showing approved versus rejected proposals over time. section 2.4.5
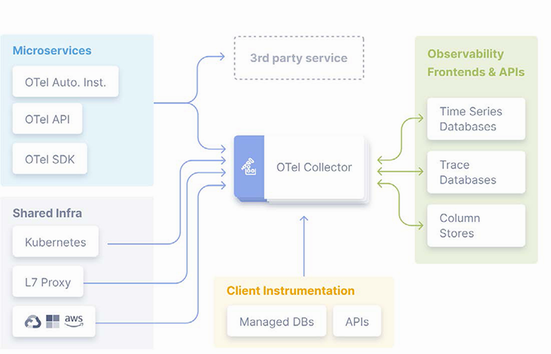
Figure 2.30 OpenTelemetry architecture and library (Source: https://opentelemetry.io/docs/)

Use the OpenTelemetry architecture diagram to relate application agents, collectors, and exported telemetry. section 2.4.5


How Platform Engineering on Kubernetes covers it

How deep it goes
Describes metrics, logs, traces, instrumentation, centralized collection, and dashboards without detailing collector configuration.
Examples
Uses centralized service telemetry and an approved-versus-rejected proposals dashboard as concrete examples.
What it assumes
Assumes distributed-service concepts and introduces telemetry through metrics, logs, traces, instrumentation, and aggregation.
What you can do after
Operate services with OpenTelemetry instrumentation and Prometheus-Grafana dashboards for behavior and performance visibility.
How it connects
Connects observability with monitoring, tracing, OpenTelemetry, Prometheus, Grafana, dashboards, and Service Level Agreements.

Also explained in

Compare how 8 books explain telemetry →

Related concepts

This explainer was generated by Manning's knowledge graph from the text of Platform Engineering on Kubernetes. The section links point to the parts of the book it draws on.





