The upper quartile, or third quartile, is the value below which 75% of observations fall when an ordered dataset is arranged ascending. It marks the boundary of the upper half of the interquartile range. section 7.1.2
In analytic work, the upper quartile helps retain the central 50% of values: observations above it can be excluded alongside values below the lower quartile before calculating variance or standard deviation. section 7.1.2
A practical workflow uses the quartile boundaries to reduce distortion from noisy connection data:
- Arrange the measurements in ascending order and identify the lower, median, and upper quartiles. section 7.1.2
- Drop rows whose time_diff_sec values fall below the lower quartile or above the upper quartile. section 7.1.2
- Calculate standard deviation and variance on the retained connection groups. section 7.1.2
Filtering connection jitter
For grouped network connection records, removing time_diff_sec values outside the lower and upper quartiles reduces the influence of jitter, outliers, and skew before statistical comparison. section 7.1.2
Figure 7.4 Quartiles for a nonnormal distribution
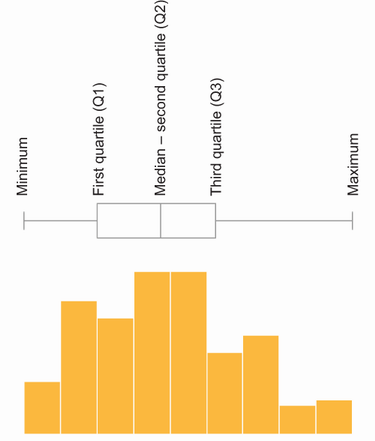
Use the quartile diagram to see how the upper quartile partitions a nonnormal distribution. section 7.1.2


