The upper quartile, also called the third quartile or 75th percentile, is the upper boundary of the middle 50% of an ordered dataset. Together with the first quartile, it defines the interquartile range; the median sits between them as the second quartile. section 6.4 section 6.4.1
In a box plot, the box extends from the first quartile to the upper quartile. The upper whisker then runs from the upper quartile to the dataset maximum, while a separate line marks the median. section 6.4 section 6.4.4
Calculate an upper quartile in D3 by producing three quartile thresholds:
- Extract the numeric values for a category, such as one group’s salaries. section 6.4.1
- Create d3.scaleQuantile() with those values as its discrete domain and four range entries: [0, 1, 2, 3]. section 6.4.1
- Call quantiles() to receive first-quartile, median, and upper-quartile thresholds; use the third returned value for the upper quartile. section 6.4.1
Positioning the top of a box plot
For each salary group, pass the third threshold to a vertical scale. That scaled upper-quartile value sets the rectangle’s y position; the box height is the scaled first-quartile position minus that upper position because SVG y coordinates increase downward. section 6.4.4
Figure 6.14 A box plot is composed of a rectangle extending from the first to the third quartile, a line positioned at the median, and whiskers extending from the minimum value to the first quartile and from the third quartile to the maximum value.
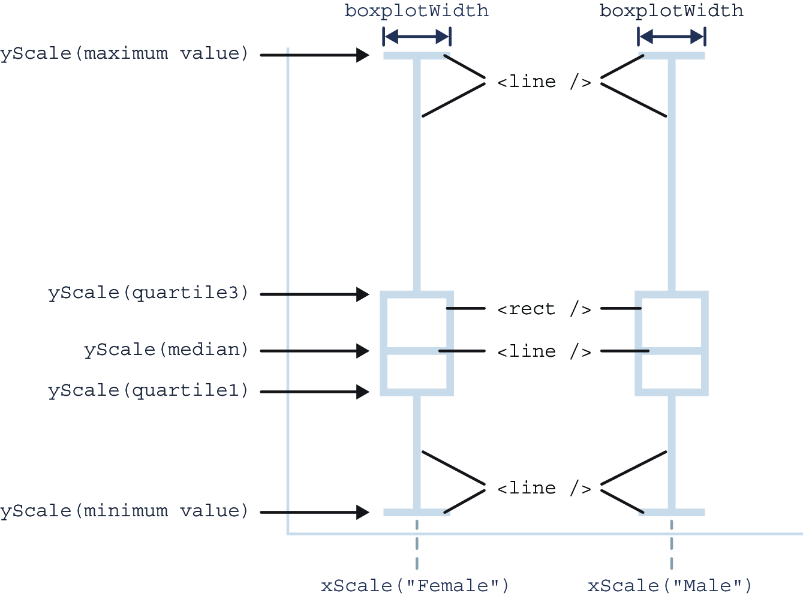
Use the diagram to see the upper quartile as the top edge of the box and the starting point of the upper whisker. section 6.4.4
The same threshold can annotate a violin plot: a line from the first to the upper quartile adds a compact summary to a shape that otherwise shows the full distribution. section 6.5


