liveBook · Manning

Adjacency matrix

As explained in Graph Algorithms for Data Science

An adjacency matrix is a square matrix whose elements indicate whether pairs of graph nodes are connected.

An adjacency matrix represents a graph as a square table. Each row and column represents a node, and each cell indicates whether the corresponding pair of nodes is connected. section 9.0

Four-node graph

For nodes A, B, C, and D, a cell containing 1 means the corresponding relationship exists; a cell containing 0 means it does not. The cell at column C and row D is 1 when C and D are connected. section 9.0

The representation has important consequences for graph machine learning:

  • A graph with one million nodes gives every node a vector with one million elements. section 9.0
  • Using the matrix as model input creates many features, makes models depend on graph size, and can increase overfitting. section 9.0
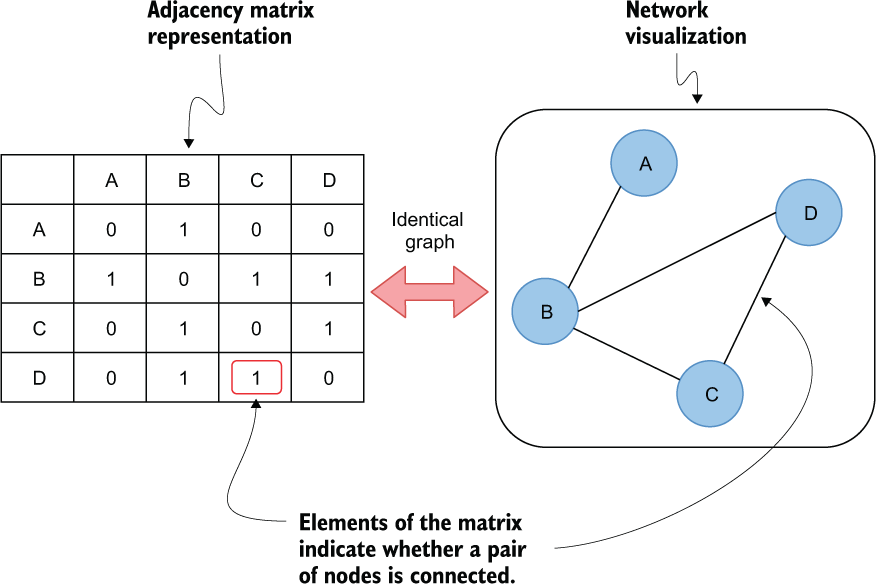
Figure 9.2 Adjacency matrix
09-02

View the four-node adjacency matrix and connect its cell values to graph relationships. section 9.0


How Graph Algorithms for Data Science covers it

How deep it goes
Defines 0/1 connectivity and scales it to million-node graphs, then identifies feature-count and overfitting problems.
Examples
Uses a four-node graph with A, B, C, and D, including a C–D cell containing 1.
What you can do after
Evaluate/understand adjacency-matrix features and their scaling and overfitting implications for graph machine learning.
How it connects
Connects graph structure with node embeddings and machine learning models.

Also explained in

Compare how 8 books explain adjacency matrix →

Related concepts

This explainer was generated by Manning's knowledge graph from the text of Graph Algorithms for Data Science. The section links point to the parts of the book it draws on.





