A z-score measures how many standard deviations a numeric value lies above or below the mean of a reference set. For value x, z = (x − mean) / standard deviation; values with large absolute scores are candidates for outlier status. section 2.1.1
Use z-scores for practical outlier screening, while checking their assumptions and sensitivity:
- Calculate a score for every numeric value, then flag values whose absolute z-score exceeds a chosen threshold. section 2.1.1
- Treat 3.0 as a common convention rather than a universal rule; domain cutoffs and data size may justify another threshold. section 2.1.1
- Use caution when extreme values distort the mean and standard deviation, causing ordinary observations to receive misleading scores. section 2.1.1 section 14.5.2
- Recognize that the method is mainly univariate and often relies on distributional assumptions, commonly Gaussian ones. section 2.9
A value near, but below, the conventional cutoff
For ten example values, the mean is 6.6 and the standard deviation is 10.04. The value 34 has a z-score of 2.73, so a 3.0 threshold flags none of the values, although 34 is close to the cutoff. section 2.1.1
Figure 2.2 A swarm plot with at least one outlier, point A. Depending on the presence of A, points B and C may or may not be flagged as outliers, as A can affect the mean and standard deviation.
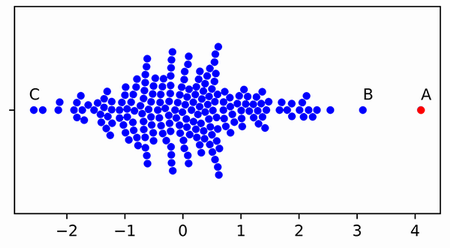
A swarm plot illustrates how one extreme observation can change the mean and standard deviation, altering whether other points are flagged. section 2.1.1







