A baseline is a reference value or range describing normal system behavior. Observations can then be compared with it to identify anomalies, trigger alerts, or investigate failures. section 2.6 section 7.1.1
In operations, establish a baseline by observing a healthy service and recording relevant signals. Metrics can provide numerical ranges, while a successful trace can show expected execution paths and durations. section 2.4.4 section 8.2.3
Baselines support several operational tasks:
- Define expectations and alert when values leave the expected range. section 2.4.4
- Compare current behavior with healthy behavior during troubleshooting. section 7.1.1 section 8.2.4
- Support capacity planning, scalability discussions, and operational goals such as SLOs. section 2.4.4
A baseline may be established manually or automated with anomaly-detection techniques. Automation can reduce effort, but retaining every signal without a strategy increases storage and network costs and can reduce observability ROI. section 2.6 section 7.1.1
Comparing a failed trace with the happy path
A Jaeger trace of the healthy microservices application establishes expected service execution and duration. After a failure, filtering spans by an error status and comparing their durations with that baseline helps locate the problematic service. section 8.2.3 section 8.2.4
Figure 8.7 Troubleshooting the demo microservices app: an example failure trace and the span that caused the failure
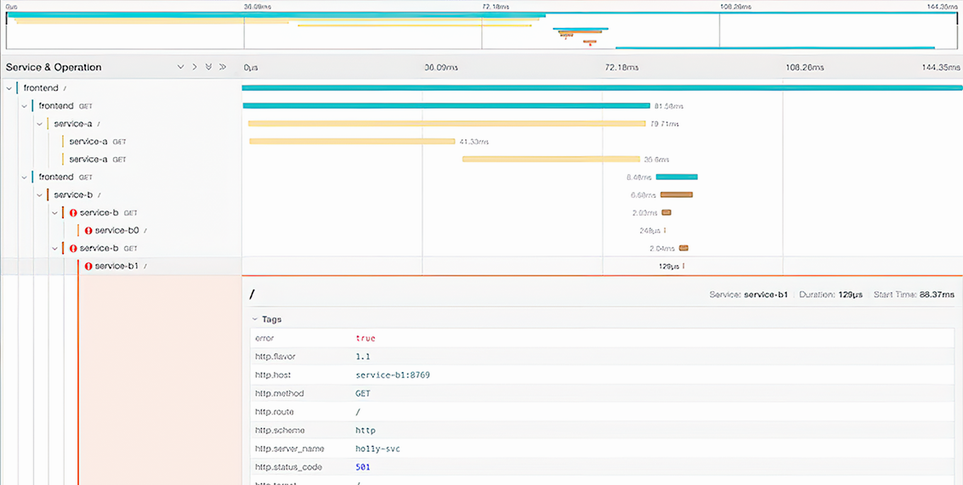
Use the failure trace to inspect the error span and compare its service duration with the healthy baseline. section 8.2.4