A benchmark is a simple reference forecast used to judge whether a model or demand-planning process is genuinely accurate. Forecast error has no useful interpretation in isolation: acceptable accuracy depends on demand complexity, granularity, horizon, and available information. The practical question is therefore not “Is our error low?” but “How much better are we than a fair alternative?” section 10.1 section 10.0
Use a simple model as the reference, then compare accuracy and bias at the same forecast lag. A moving average is a strong default because it is straightforward, free, and usually more competitive than a naïve forecast. Test several moving-average windows—often three to six periods—and retain the best suitable benchmark rather than choosing an artificially weak one. section 10.1.2 section 10.3
Why a naïve benchmark can mislead
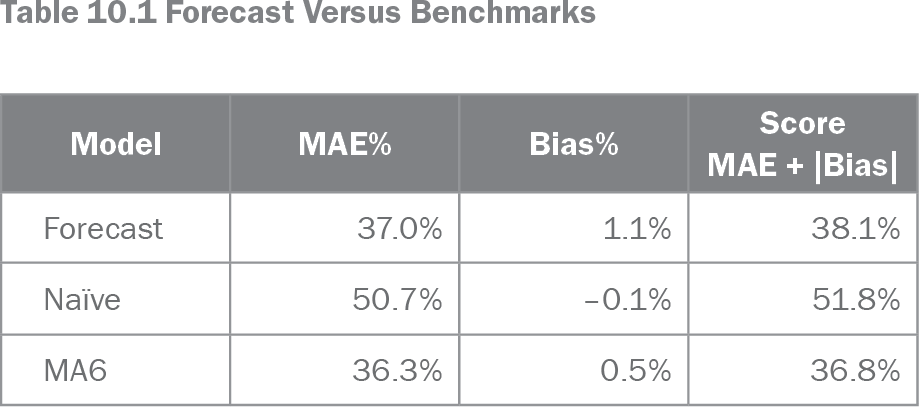
A naïve forecast repeats the latest observation: after sales of 10 units today, it predicts 10 units for every future day. Although widely recommended, it can be so inaccurate that almost any method beats it. In the illustrated comparison, the forecast scores 38.1% on MAE plus absolute bias, versus 51.8% for naïve forecasting and 36.8% for a six-period moving average. Beating the naïve result alone is not a satisfactory claim. section 10.1.1 section 10.1.1
Table 10.1 Forecast Versus Benchmarks (view table figure)
| Model |
MAE% |
Bias% |
Score MAE + |Bias| |
|---|---|---|---|
| Forecast |
37.0% |
1.1% |
38.1% |
| Naïve |
50.7% |
–0.1% |
51.8% |
| MA6 |
36.3% |
0.5% |
36.8% |
Compare forecast, naïve, and moving-average results side by side to see why benchmark strength changes the conclusion. section 10.1.1
Make benchmark comparisons credible:
- Match the lag: compare an M-3 forecast with a benchmark built using information available three months earlier. section 10.1.2
- Evaluate on periods not used to select or optimize the model; otherwise, apparent superiority may be overfitting rather than future performance. section 10.1.2
- Track the model and benchmark continuously, not as a one-off test, because performance can change over time. section 10.1.2
- Use benchmarks to set achievable accuracy objectives instead of arbitrary targets that invite metric manipulation. section 12.2.3
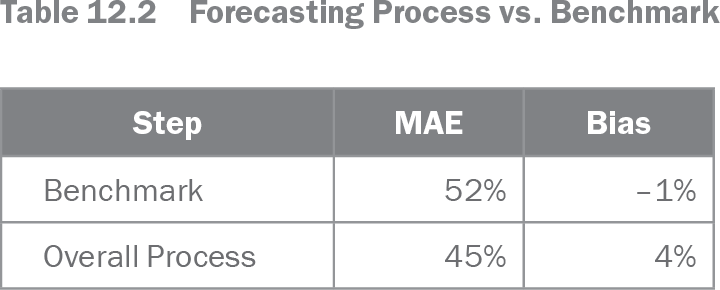
Internal benchmarks run a simple algorithm through the organization’s own historical demand and compare its results with the baseline model or full forecasting process. The gap measures added accuracy relative to a low-cost alternative and helps assess whether software, time, and planning effort are producing enough value. If the process cannot beat a suitable benchmark, the benchmark itself may be the better model. section 12.1.1 section 12.2.4
Table 12.2 Forecasting Process vs. Benchmark (view table figure)
| Step |
MAE |
Bias |
|---|---|---|
| Benchmark |
52% |
–1% |
| Overall Process |
45% |
4% |
This process comparison pairs MAE and bias for a benchmark and the overall forecasting process. section 12.1.1
Avoid treating industry benchmarks as a substitute for an internal comparison. Companies may use different accuracy metrics, aggregation levels, horizons, portfolios, channels, and strategies; survey-based figures may also be unreliable. A competitor’s reported accuracy therefore says little about whether a particular process adds value across its own relevant horizon. section 12.1.2 section 12.3
Benchmarks also put ambitious model claims in perspective. Forecasting competitions can show improvements over a stated benchmark, but differing metrics and reference models make results hard to compare across competitions. Large gains may reflect a simplistic benchmark, while advanced models should be assessed against an appropriate moving-average baseline and consistent evaluation setup. section 15.3.1 section 15.3.1