A benchmark is a reference point for comparing a metric’s observed value. Benchmarking is the act of making that comparison. A relevant benchmark puts performance in context and can anchor a goal because it reflects a level of performance already achieved elsewhere. section 7.2.2
Choose a reference that fits the metric and the decision:
- Compare with organizations similar in industry, size, geography, and type of service when judging a feasible target. section 7.2.1
- Look for industry averages, peer-reviewed research, or public data from governments and other organizations when those sources measure something relevant. section 7.2.2
- Examine your own metric’s history alongside the benchmark. Long-term trends—ideally spanning at least two years—help reveal seasonal changes that a single comparison could miss. section 7.2.1
Customer churn
Plotting a company’s customer churn rate against an industry benchmark shows whether its rate tends to be higher. A persistent gap suggests room to improve retention; it does not, by itself, identify which actions will reduce churn. section 7.2.1
Figure 7.8 This chart shows a company’s customer churn rate compared to an industry benchmark. Here, churn tends to be higher than the benchmark, which suggests there may be room for improvement in the customer retention rate.
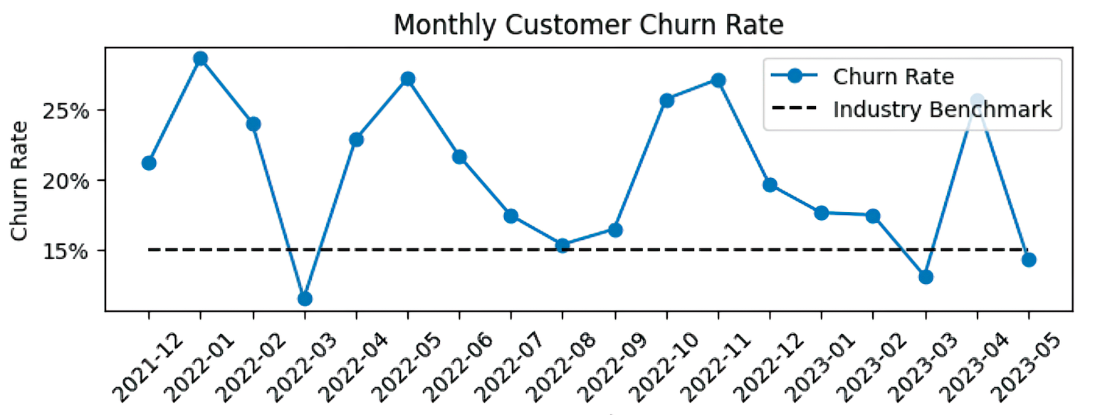
The chart makes the comparison visible over time: the company’s churn rate tends to exceed the industry benchmark. section 7.2.1
Treat a benchmark as context, not an automatic target. Set an achievable goal using historical patterns, comparable performance, factors that predict the metric, and constraints outside the organization’s control. Then identify actions that could plausibly change the result. section 7.2.1 section 7.2.2