Categorical data contains values whose order is not inherently meaningful. It commonly appears in dimensions and contrasts with sequential data, where position or progression matters. section 3.4.2 section 3.4
Recognize categorical values by their role:
- Use categories for labels such as sales regions, rather than treating their names as ranked quantities. section 2.1.1
- Do not reorder inherently sequential values—such as funnel steps, pain levels, generations, or survey scales—just to make a chart look tidier. section 3.4.2
- Use color carefully to distinguish categories or flag a condition, and pair it with another cue because color alone excludes some readers. section 2.1.1
A crosstab that tells a story
A bike-rental crosstab lists average trip duration by hour and weekday. Marking durations of 16 minutes or less in red makes short-trip patterns—especially weekday morning commutes—immediately visible. The color turns a wall of numbers into a readable signal, though a second cue can make it more accessible. section 2.1.1
Figure 2.1 Crosstab showing the average duration of bike rentals in minutes by hour of the day and day of the week. Powered by Transport for London (TfL) Open Data. Contains OS data © Crown copyright and database rights 2016 and Geomni UK Map data © and database rights (2019)
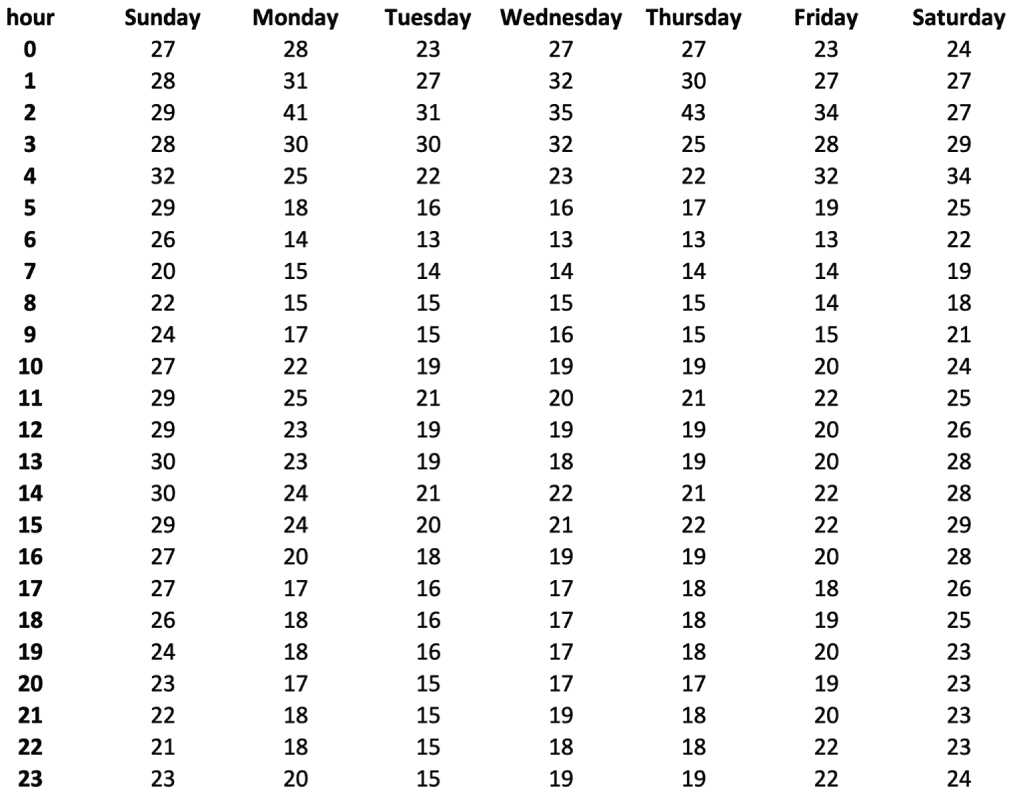
Inspect the uncolored bike-rental crosstab before comparing it with the highlighted version. section 2.1.1
Figure 2.2 The same crosstab as in figure 2.1, but with the values less than or equal to 16 marked in red
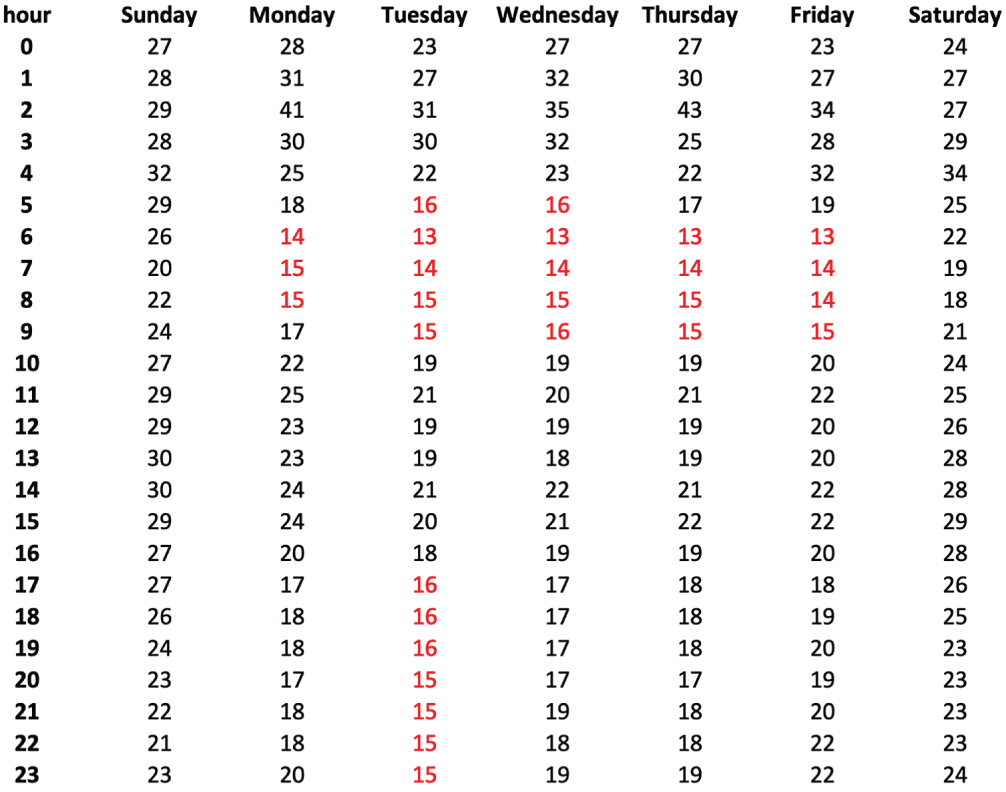
Compare the same crosstab with values at or below 16 marked in red. section 2.1.1















