Categorical data records which category a value belongs to rather than measuring its magnitude. In a table, categorical columns typically have a relatively small set of distinct values repeated across rows. Department and expense account are examples; an amount is numeric, while a free-text column tends to contain longer, often unique entries. A staff ID can also be categorical even when written as digits: its role is to identify a category, not express a quantity. section 2.0
For outlier detection, the useful question is often how frequently categories occur:
- Count each distinct value. A candidate outlier is not merely rare, but unusually rare compared with the other values. There is no numeric notion of an internal outlier between categories. section 2.2
- Choose a cutoff in light of the count distribution. A fixed minimum count or a fixed number of rarest values can under- or overreport; cumulative counts offer another way to set a threshold. A low count alone is not always distinctive. section 2.2 section 2.9
- Count combinations when the unusual pattern spans columns. A combination of location, abbreviation, and species may be uncommon even when its individual values are not. With more columns or higher cardinality, however, many combinations can naturally have low counts. section 2.4 section 2.4.1
Detector choice changes the preparation required. Most detectors expect numeric data, some expect categorical data, and few accept both directly. A numeric detector therefore usually needs categories encoded, for example with one-hot or ordinal encoding; a categorical detector may instead require numeric features to be binned. Compare a detector’s data-type support with its robustness, interpretability, and ability to find the outliers of interest rather than assuming one method fits every table. section 3.3.2 section 3.3
A categorical clustering check
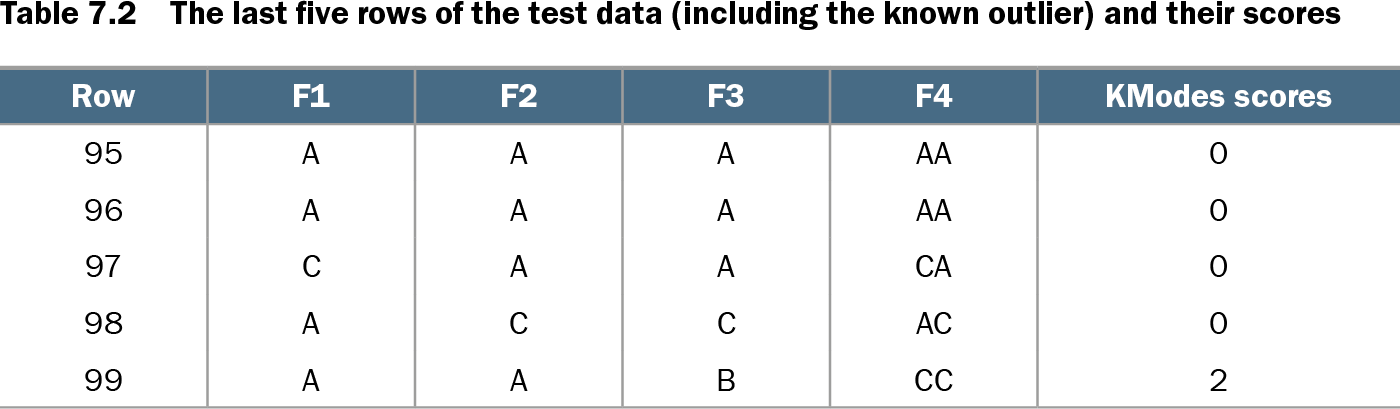
KModes can cluster categorical rows, then score a row by how many cells differ from its cluster center. In a synthetic four-column example, most rows follow consistent relationships between columns and score zero; an inserted row breaks two relationships and scores two. This demonstrates a different signal from rarity in a single column, not a guarantee that every high-scoring row is a meaningful anomaly. section 7.8.3
Table 7.2 The last five rows of the test data (including the known outlier) and their scores (view table figure)
| Row |
F1 |
F2 |
F3 |
F4 |
KModes scores |
|---|---|---|---|---|---|
| 95 |
A |
A |
A |
AA |
0 |
| 96 |
A |
A |
A |
AA |
0 |
| 97 |
C |
A |
A |
CA |
0 |
| 98 |
A |
C |
C |
AC |
0 |
| 99 |
A |
A |
B |
CC |
2 |
Compare the ordinary rows’ zero scores with the inserted row’s score of two to see how categorical cluster-center differences appear in the results. section 7.8.3