Categorical data records membership in a discrete set of labels rather than a continuously measured quantity. In a table of national currencies, Country, Currency name, Currency symbol, and ISO 4217 code are categorical because each draws from a finite, relatively small set of valid values. A categorical column may store string labels or integers mapped back to labels through a conversion dictionary. section 1.1 section 2.1.2
Figure 1.1 An example of tabular data
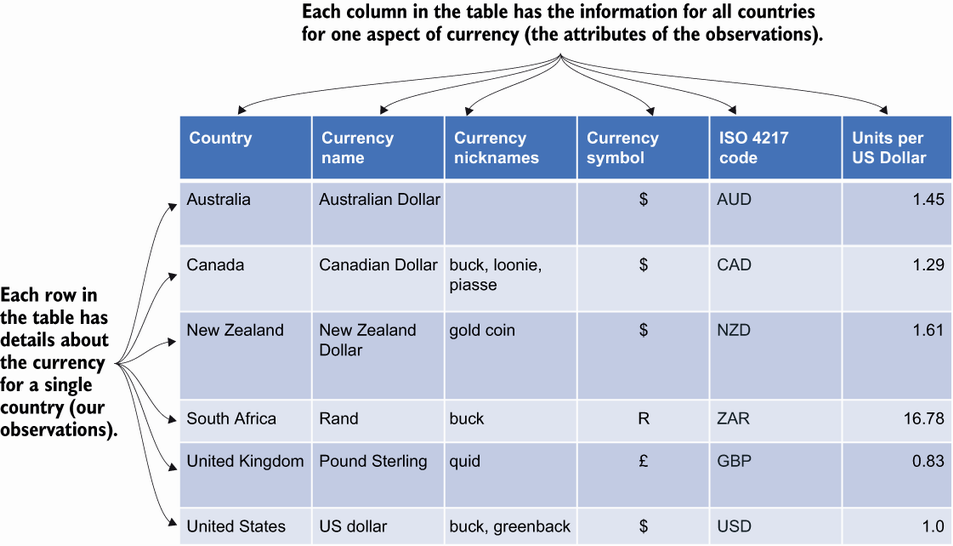
Use the currency table to contrast categorical identifiers with free-form text and a continuous exchange-rate value. section 1.1
Do not infer meaning from a storage type alone. Integers can represent numeric measurements, ordered rankings, or categories. A small number of distinct values is a useful clue, but domain knowledge determines whether a value has an order: cylinder count can be treated as ordinal because it tends to relate to engine power, while origin can be treated as categorical. section 2.1.2 section 2.4.2
Identify and prepare categorical columns with a short exploratory workflow:
- Inspect a sample of rows to understand what each value appears to represent. section 2.4.2
- Count distinct values with pandas `nunique()`; few distinct values can indicate a categorical variable even when values are numeric. section 2.4.2 section 9.1
- Check value counts for category frequencies and unexpected labels, including rare categories or incongruencies. section 2.4.2 section 2.5
- Choose a representation suited to modeling: one-hot encode a value into binaries, or embed a categorical value as continuous numerical features. section 2.4.2
Classifying property listings
A real-estate listing mixes different column types. Location names a neighborhood, Property Type contains values such as Condominium and Serviced Residence, and Furnishing records whether a property is furnished; these describe categories. Price is a listed monetary value, while Rooms, Bathrooms, and Car Parks look numeric but require inspection before deciding whether they are continuous, ordinal, or categorical. `df.describe()` validates numeric columns, and `df.nunique()` reveals each column’s number of distinct values. section 9.1 section 9.1
Cardinality—the number of distinct labels—matters in tabular work. Categorical features may have low or high cardinality, and their processing differs from numeric, ordinal, and date columns. During exploratory data analysis, examine category distributions alongside missing values and other column problems before modeling. section 2.5 section 2.5















