liveBook · Manning

Central Limit Theorem

As explained in Experimentation for Engineers

A theorem stating that suitably normalized sums or averages of many observations tend toward a normal distribution.

The Central Limit Theorem makes a normal distribution a practical approximation for standardized aggregate measurements as the number of individual measurements increases. It supports engineering decisions while preserving uncertainty: the approximation is useful, not exact. section 2.3.1

A/B testing with z scores

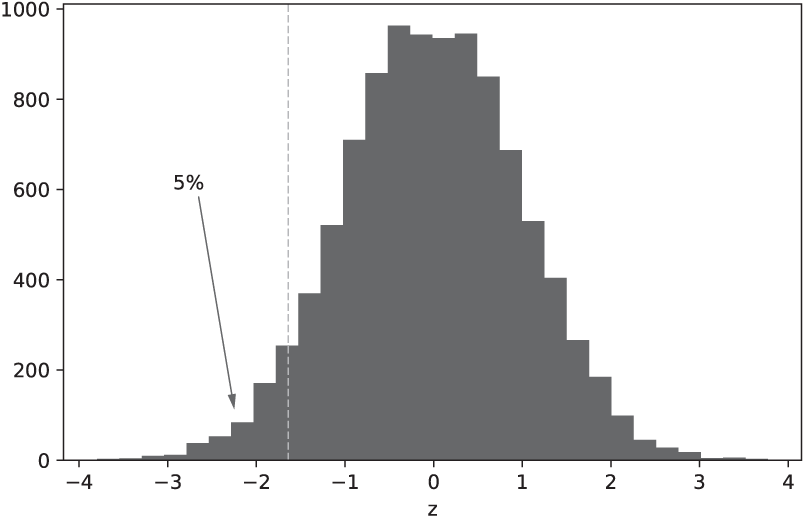
Compare execution costs on ASDAQ and BYSE, compute the difference and its standard error, then standardize the result as z. Under the unit-normal approximation, z < -1.64 marks the lower 5% tail: act as though BYSE is better. The cutoff controls false positives at 5%, but the decision remains a bet rather than a certainty. section 2.3.1

Figure 2.8 The distribution of z scores has mean zero (by assumption) and standard deviation one. The shaded area to the left of the vertical line is 5% of the total shaded area. The probability of a measurement of z having a value to the left of the vertical line is 5%.
02-08

Use the unit-normal histogram to inspect the 5% tail and the z = -1.64 decision boundary. section 2.3.1


How Experimentation for Engineers covers it

How deep it goes
Explains the increasing-sample approximation and applies a unit-normal cutoff, but does not derive convergence or assumptions in detail.
Examples
Uses ASDAQ-versus-BYSE execution costs, a z = -1.64 cutoff, and a unit-normal tail visualization.
What it assumes
Assumes aggregate measurements, standard errors, z scores, and normal-distribution tail probabilities.
What you can do after
Evaluate A/B-test evidence with a normal approximation while recognizing false-positive risk and business trade-offs.
How it connects
Connects aggregate measurements, standard errors, z scores, normal distributions, and false positives in A/B testing.

Also explained in

Compare how 3 books explain Central Limit Theorem →

Related concepts

This explainer was generated by Manning's knowledge graph from the text of Experimentation for Engineers. The section links point to the parts of the book it draws on.
