Conditional probability describes how likely an event is after restricting attention to cases where another event or condition is known. In data terms, conditioning on X = a means filtering the rows to those with X = a, then recalculating the distribution of another variable. section 1.5.2
The restriction can change what appears likely. In simulated data, Z = A occurs 3/5 of the time overall but 1/2 of the time among rows where X = a, written P(Z = A) = 3/5 and P(Z = A|X = a) = 1/2. The formal calculation divides the joint probability by the probability of the condition. section 1.5.2
Use conditional probability to:
- Describe what has been observed among a selected subpopulation, including cases selected by two or more conditions. section 1.5.2
- Distinguish prediction from intervention: P(R = 1|T = A) describes recovery among patients who received treatment A, whereas P(R = 1|do(T = A)) asks what would happen if everyone received it. section 2.2.4
- Support supervised learning, whose target for categorical outcomes is a conditional probability, while recognizing that prediction depends on future events resembling past data. section 4.0 section 4.6
Treatment and recovery
Historical data may show P(R = 1|T = A) = 78% because the patients receiving treatment A have a particular mix of kidney-stone sizes. Giving treatment A to everyone changes that mix and produces the intervened recovery rate P(R = 1|do(T = A)) = 83%. The two probabilities answer different questions. section 2.2.4
Table 1.2 Simulated data
|
X
|
Y
|
Z
|
|---|---|---|
|
3
|
0.03
|
A
|
|
6
|
–24.08
|
A
|
|
a
|
7.01
|
A
|
|
–2
|
–3.00
|
B
|
|
a
|
10.89
|
B
|
Inspect the simulated rows before conditioning, then compare them with the filtered table for X = a to see how a condition changes frequencies. section 1.5.2
Figure 2.20 Differences between the conditional probability, the intervened probability, and the adjustment formula for the cases of an RCT, a confounder, and a mediator. The equal and unequal signs determine whether the adjacent quantities agree. T stands for Treatment, C for Confounder, M for Mediator, and X for Covariates.
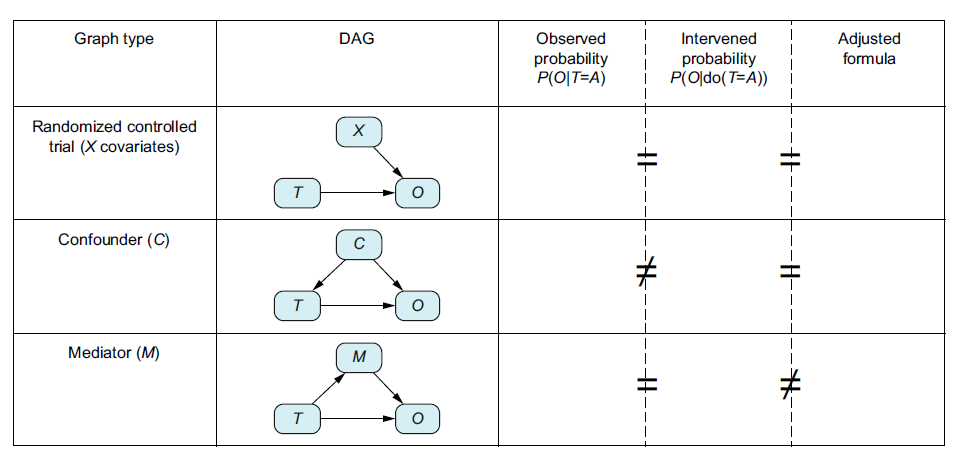
Compare conditional probability, intervened probability, and adjustment-formula estimates across randomized trials, confounding, and mediation. section 2.5.10










