A critical z-value is a cutoff on the standard normal bell curve. It marks the edge of a chosen central area or, in hypothesis testing, the edge of a tail region considered statistically significant. Think of it as a boundary line: where a z-score lands relative to that line changes the conclusion. section 5.3 section 6.6
Figure 5.4 Breaking down the center .95 area in the bell curve and demonstrating the symmetry
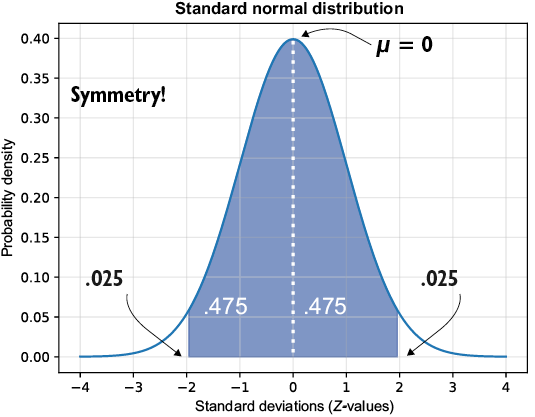
For a two-sided 95% central area, split the remaining 5% evenly: 2.5% sits in each tail. The symmetric boundaries are the critical z-values. section 5.3
For a two-sided confidence interval or test with central area A, find the positive boundary with `norm.ppf(1 - (1 - A) / 2)` and use both `-z` and `+z`. At 95%, the boundaries are approximately ±1.959964. Values beyond those boundaries lie in the two tail areas. section 5.3 section 6.6
Tail choice changes where the cutoff goes:
- In a two-tailed test, split alpha between both tails and reject when the test z-score falls outside the symmetric critical range. section 6.6
- In a left-tailed test, place all alpha in the left tail; at 95% confidence, the critical boundary is about -1.644854. section 6.9
- In a right-tailed test, place all alpha in the right tail; at 95% confidence, the critical boundary is about 1.644854. section 6.9
Potato-chip weight claim
Suppose a bag is claimed to weigh 142 grams on average. With a sample mean of 140.2, sample standard deviation 4.79, and 41 bags, the test z-score is about -2.4062. In a two-tailed test at alpha = 0.05, it falls outside [-1.959964, 1.959964], so reject the claim. In a left-tailed test, it also falls beyond the -1.64485 cutoff. A cutoff supports a decision under the chosen rule; it is not automatic proof of a real-world claim. section 6.6 section 6.10
Critical z-values also power confidence intervals: the central area selected on the standard normal curve helps define a range used to estimate a population mean or proportion from a sample. Smaller samples estimating a mean may instead call for the t-distribution. section 5.9 section 5.2
