For a multiclass node-classification model, loss gives a way to track prediction error: lower is better. Log loss is used alongside F1 score to compare GCN and GraphSAGE models. The reported scores are evaluation results; they do not show how to configure PyTorch’s CrossEntropyLoss module or what inputs to pass to it. section 3.1.4
Use loss at two points in the workflow:
- Plot training and validation loss after each epoch. If training loss keeps falling while validation loss rises, the model is overfitting; retain the model instance with the lowest validation loss. section 3.1.4
- Compare validation-set log loss with F1 score. A single score need not settle model choice: prediction requirements and the consequences of errors matter. section 3.1.4 section 3.2.1
Choosing a neighborhood aggregation
With mean, sum, and max aggregation in GraphSAGE, max has both the highest F1 score (0.7449) and lowest log loss (2.1039). A later list-aggregation comparison is less straightforward: the standard list raises F1 to 0.7484 but also raises log loss to 2.622. Check both measures rather than treating an F1 improvement as an across-the-board gain. section 3.2.1 section 3.2.2
Figure 3.1 Training and validation loss curves for the GCN model (left) and GraphSAGE model (right) trained in this section. The divergence of the validation from the training curve signals over-fitting, where the model learns the training data too well and at the expense of generalizing to new data.
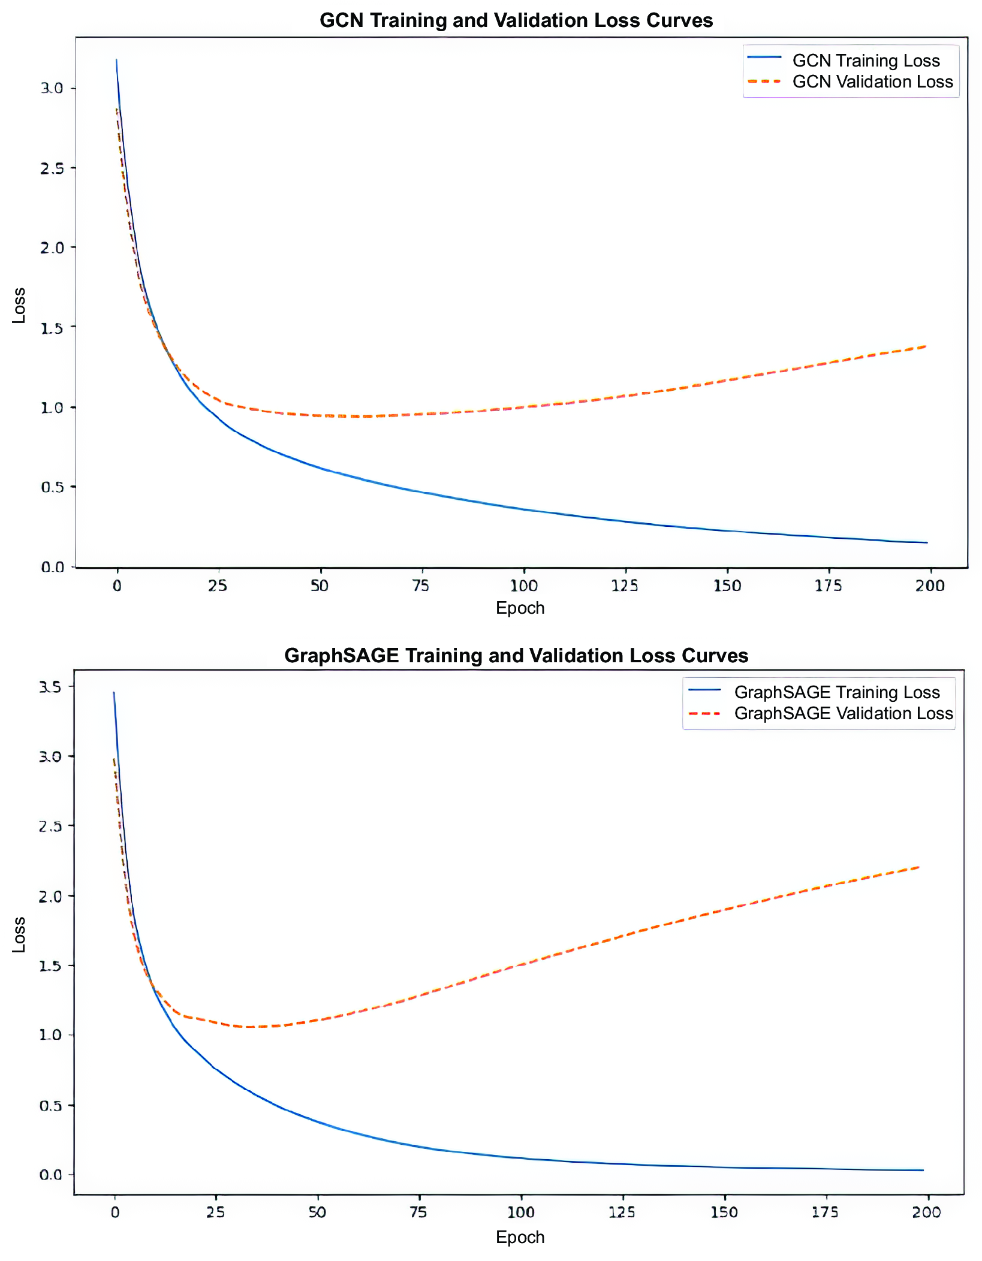
The training and validation curves make the point where falling training loss stops indicating better generalization visible. section 3.1.4