Suppose an image-search system represents each image as a point and uses a k-d tree to find similar images. As the number of dimensions grows, the tree’s nearest-neighbor search becomes exponentially more expensive. Around 30 dimensions, a k-d tree may offer no advantage over brute-force search. This deterioration is one form of the curse of dimensionality. section 10.1
The problem is not limited to tree traversal. Under certain data-distribution assumptions, distances become less useful for distinguishing neighbors: in sufficiently high dimensions, the ratio of nearest-neighbor to farthest-neighbor distance approaches 1. In k-means, this can make assignment to the nearest centroid inaccurate and slow convergence. DBSCAN faces a similar problem when it uses Euclidean distance. section 12.2.2 section 12.3.4
Why a spherical cluster can be a poor fit
Imagine data spread uniformly through a high-dimensional hypercube. A sphere small enough to fit inside the cube excludes most points; a sphere large enough to contain them wastes an amount of space that grows exponentially with dimension. Spherical cluster boundaries can therefore overlap substantially even when they appear to be a reasonable approximation at lower dimensions. section 12.2.2
Choose a response according to what the application can sacrifice:
- For similarity search, project objects into fewer dimensions using PCA or a Discrete Fourier Transform, if the projection preserves enough distinguishing information. This is less effective for dynamic datasets. section 10.4.3
- If exact matches are not essential, prune search branches more aggressively or stop when the current result is good enough. Both can speed queries at the cost of accuracy. section 10.4.3
- For DBSCAN, consider a metric other than Euclidean distance; changing the metric does not remove the separate difficulty of choosing suitable ε and minPoints across varying densities. section 12.3.4
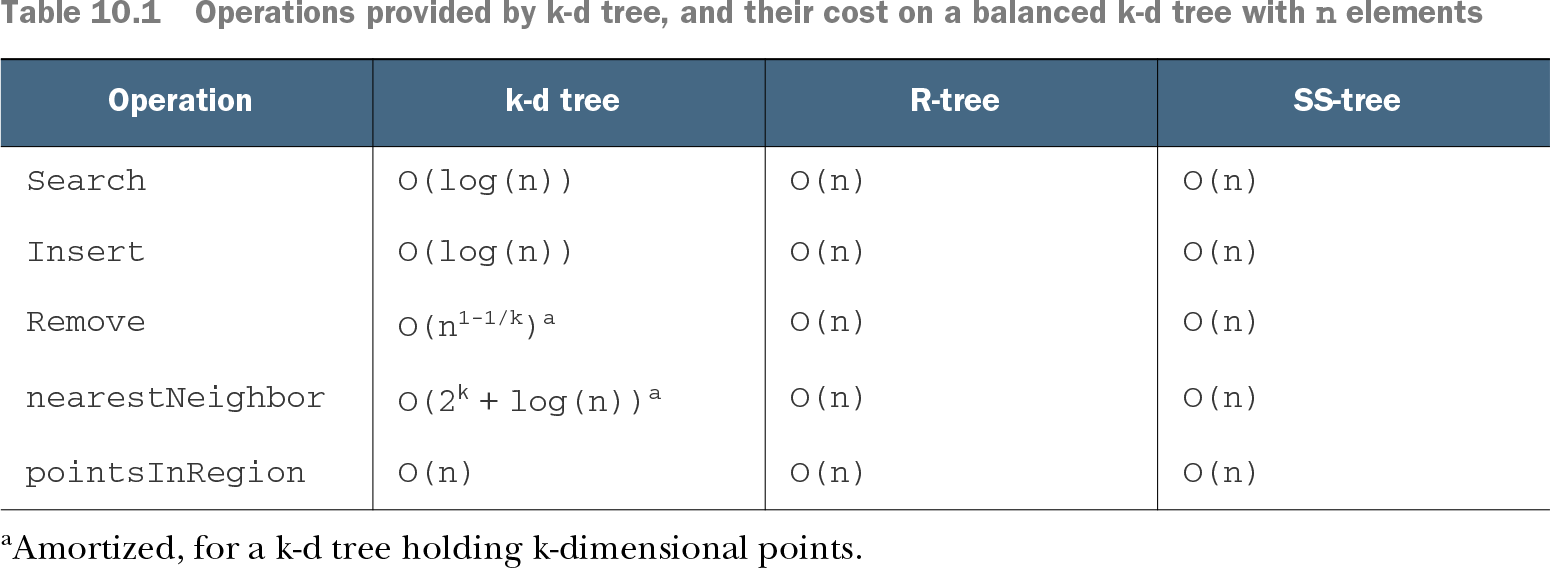
Tree design can mitigate, but not erase, the search problem. SS-trees use spherical bounding envelopes rather than the single-axis splits of k-d trees; R-trees use rectangular envelopes. Which envelope fits better depends on the data distribution. Even with a balanced k-d tree, the listed nearest-neighbor cost is O(2^k + log n) for n points in k dimensions, so increasing k can dominate the search cost. section 10.5.1
Table 10.1 Operations provided by k-d tree, and their cost on a balanced k-d tree with n elements (view table figure)
|
|
|||
|
|
|||
Compare the listed operation costs, particularly the dimension-dependent nearest-neighbor cost for a balanced k-d tree. section 10.5.1