The curse of dimensionality is the difficulty of finding meaningful patterns when a dataset has many features. In outlier detection, a record may be unusual in just one feature or a small combination of features, yet hard to distinguish when a detector considers every column at once. More features do not necessarily provide stronger evidence of an outlier. section 3.1
Two difficulties are especially important:
- Data becomes sparse. Dividing a space into bins creates an enormous number of possible combinations as features are added. Even a table with fewer than 20 features may have no duplicate rows, so a unique combination of values is not, by itself, useful evidence of an outlier. Associations between features reduce this problem but do not eliminate it. section 3.1.1
- Distances become less informative. A detector may judge a record by its distance from other records, but differences across many ordinary features can overwhelm an exceptional difference in one feature. As distances between points become roughly alike, distance-based outlier scores can lose their ability to separate unusual records. section 3.1.3
An outlier hidden by extra features
Suppose a point is unusual in feature A but ordinary in features B, C, and D. Its distance from other points can clearly separate it in four dimensions. If the table instead has 100 features and the other 99 contribute ordinary variation, that separation may disappear in the overall distance calculation. The point has not become less unusual in A; the measure has become less useful for finding it. section 3.1.3
Figure 3.1 A scatterplot of features A and B (left) and scatterplot of features C and D (right). A point (drawn as a star) is shown that is an outlier in A, though is normal in features B, C, and D. Its distance to the other points in 4D space will separate it well from the other points, but this could fail in much higher dimensional spaces.
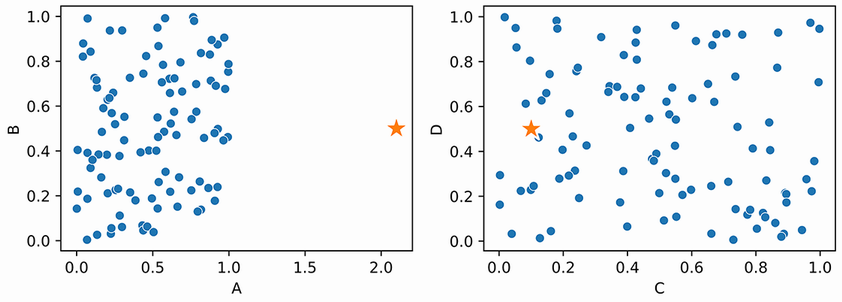
The paired scatterplots show the point that is unusual in A but ordinary in the other displayed features. They provide a low-dimensional starting point for the distance example. section 3.1.3
Detector choice therefore matters. Distance-, density-, and clustering-based methods can struggle with very high-dimensional data; they also require numeric features on comparable scales so that large-valued features do not dominate distances. Univariate tests avoid the high-dimensional distance problem, though they cannot capture every unusual combination of features. Removing features, applying dimensionality reduction such as PCA, or examining subsets of features are possible responses. None establishes that a flagged record is meaningful without further assessment. section 3.2 section 3.3.6 section 3.1.3
The same caution applies to embeddings. A vector with hundreds or thousands of elements may contain many elements irrelevant to outlier detection. Treating it like an ordinary table and applying a standard detector such as KNN can therefore work poorly; a representation useful for prediction is not automatically useful for detecting outliers. section 16.5.2






