The curse of dimensionality describes the difficulties created by datasets with many variables. High-dimensional data becomes harder to analyze, visualize, and model, especially when observations are fewer than variables. section 3.2 section 3.11
Adding dimensions can make data sparse, increase mathematical complexity and processing time, and encourage overfitting. The Hughes phenomenon describes performance improving initially, then declining as irrelevant variables accumulate. section 3.11
Figure 3.1 Only one dimension is required to represent the data points—for example, to represent the height of an object (left). We need two dimensions to represent a data point. Each data point can correspond to the length and width of an object, which can be used to calculate the area (middle). Three dimensions are required to show a point (right). Here, it can be length, width, and height, which are required to get the volume of an object. This process continues based on the number of dimensions present in the data.
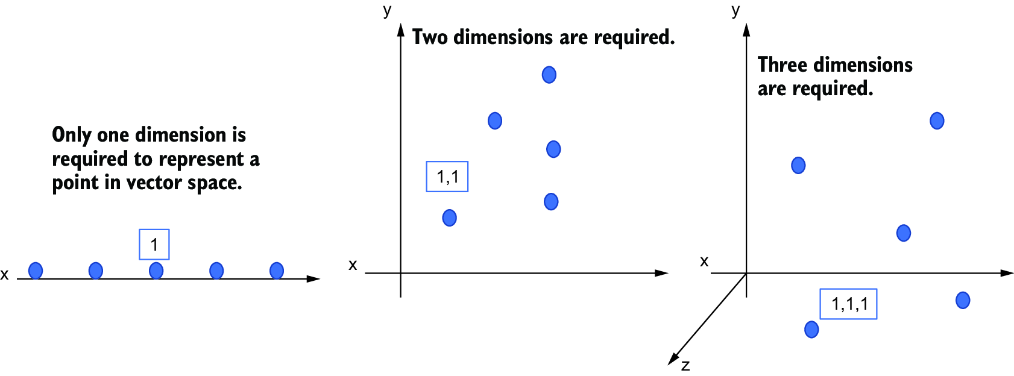
Use the dimensional progression from one attribute to three attributes to visualize why each additional variable expands the representation space. section 3.2
Customer targeting
A retailer may select customers using age, gender, budget, preferred category, average spending, and shopping frequency. Examining all variables simultaneously can make targeting tedious and confusing, motivating dimension reduction. section 3.2
Reduce the practical effects of high dimensionality by:
- Cleaning the data and performing exploratory analysis before reduction. section 3.11
- Dropping insignificant variables or combining related variables logically. section 3.11
- Normalizing data and converting categorical variables to numeric form before applying reduction algorithms. section 3.11
- Using PCA, SVD, LDA, or t-SNE to transform high-dimensional data into lower-dimensional representations. section 3.0 section 3.11






