liveBook · Manning

Data analysis

As explained in Claude at Work

Data analysis is the systematic examination, transformation, and interpretation of data to identify patterns or answer questions.

Data analysis can turn local datasets into evidence about relationships between measures. A practical workflow extracts files, checks their structure, runs analysis code locally, and reviews the findings. section 3.3

For an exploratory analysis:

  • Inspect the ZIP files and sample CSV rows before analyzing the data. section 3.3
  • State the relationships to investigate, then use code for querying, aggregation, and statistical functions. section 3.3
  • Check the source of added data: population figures were summarized from model training data after a download was assumed unavailable. section 3.3

Country-level comparisons

Explore whether internet use and researcher numbers, or either measure and space launches, are correlated across countries; generate charts and a report from the analysis. section 3.3
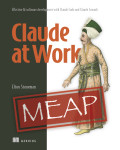

How Claude at Work covers it

How deep it goes
Demonstrates extraction, CSV inspection, and Python analysis, but does not describe methodological validation.
Examples
Compares internet use, researcher numbers, and space launches by country using Our World in Data files.
What you can do after
Apply via Claude Desktop and Cowork to analyze local ZIP files, generate charts, and save a report.
How it connects
Connects exploratory analysis with CSV files, Python, pandas, SciPy, population normalization, and charting.

Also explained in

Compare how 12 books explain data analysis →

Related concepts

This explainer was generated by Manning's knowledge graph from the text of Claude at Work. The section links point to the parts of the book it draws on.