liveBook · Manning

Data analysis

As explained in Data Storytelling with Altair and AI

The process of examining, transforming, and interpreting data to produce findings or insights.

Data analysis examines, transforms, and interprets data to produce findings or insights. It serves as the middle phase between exploring data and presenting its meaning to an audience. section 1.1

A practical analysis workflow connects three stages:

  • Explore data to understand what it contains. section 1.1
  • Analyze data to identify findings and insights. section 1.1
  • Present results with the audience’s needs in view, rather than relying on charts alone. section 1.1
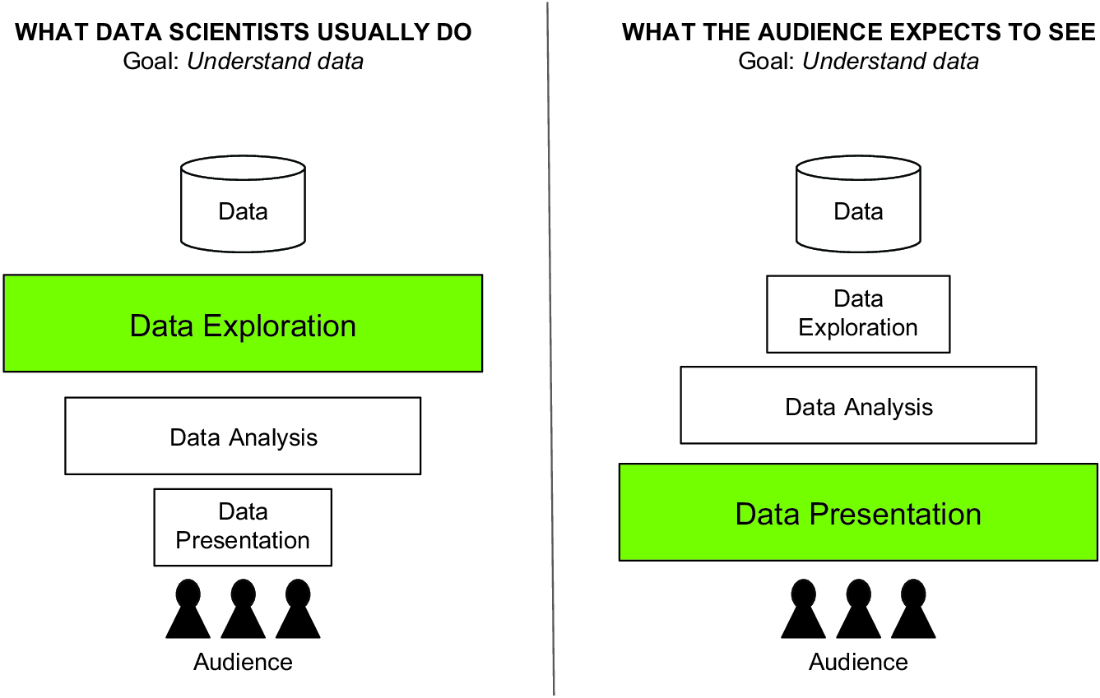
Figure 1.1 The data science flow from the data scientist’s perspective (on the left) and the audience’s perspective (on the right)
figure

Follow the contrasting analyst and audience perspectives across exploration, analysis, and presentation. section 1.1


How Data Storytelling with Altair and AI covers it

How deep it goes
Defines analysis within a three-phase workflow but does not detail specific analytical methods or implementations.
Examples
Uses data exploration, analysis, and presentation as stages, spanning government, education, finance, entertainment, and healthcare contexts.
What you can do after
Evaluate/understand findings and prepare them for compelling communication to an audience.
How it connects
Connects data analysis with data exploration, data presentation, data visualization, data storytelling, and data science.

Also explained in

Compare how 10 books explain data analysis →

Related concepts

This explainer was generated by Manning's knowledge graph from the text of Data Storytelling with Altair and AI. The section links point to the parts of the book it draws on.