A data model organizes data for a purpose. In analytics, that means shaping warehouse tables around questions people need to answer, rather than leaving every analyst to repeat the same joins, filters, and corrections. Useful models combine, aggregate, or denormalize relevant sources into schemas that reflect how an organization operates. section 11.4
Start with the work the model must support: recurring stakeholder questions, commonly used tables, and analysts’ repeated pain points. Analytics engineers work with analysts to turn complex preparation into curated models, so analysis takes less time to begin. A model is only as trustworthy as its inputs: incorrect dates, mislabeled records, and other quirks can otherwise carry confusion into every query. section 11.4.1 section 11.3
For an analytics-focused star schema, check that:
- The central fact table represents a meaningful process or event, such as a transaction, page view, or click. section 11.4.2
- Connected dimension tables hold useful attributes and derived measures that reduce additional joins. section 11.4.2
- Columns are readable and consistently formatted, while analysts and stakeholders agree on calculations before those measures enter the warehouse. section 11.4.2
Figure 11.21 Star schemas have fact tables at the center connected to dimensions with related attributes.
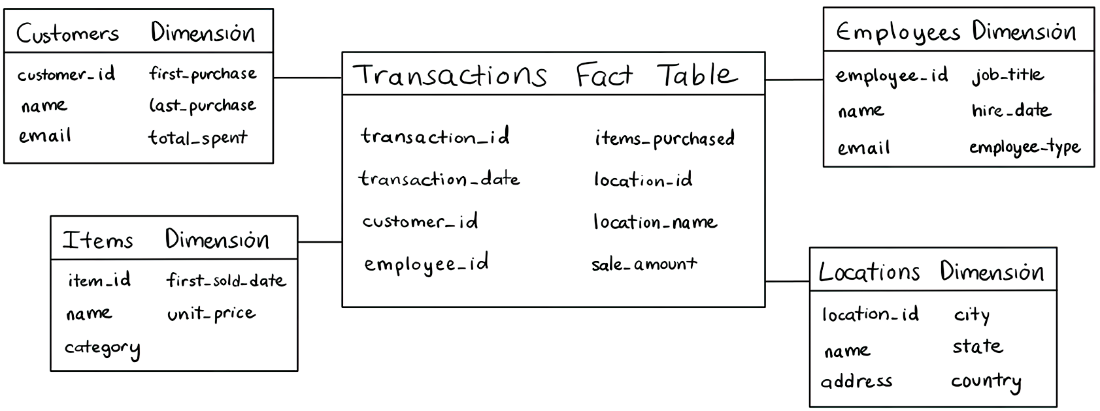
The diagram shows the defining relationship in a star schema: a central fact table connected to dimensions containing related attributes. section 11.4.2
Modeling weather for business analysis
Weather data can become difficult to use when an API names locations differently from warehouse tables or formats dates inconsistently. Saving a shared zip-code join key and standardizing timestamps makes the sources easier to combine. Retaining forecast versions supports later accuracy analysis; a most-recent flag serves current operational needs. Weekly aggregates let dashboards display weather alongside business metrics without repeating that preparation on each refresh. section 11.3.1
Choose structure with the people who will use it. A star schema is not simply a reversal of normalization: its facts, attributes, and calculations must reflect organizational priorities. Revisit the model when repeated query work or data-quality exceptions show that it no longer serves those needs. section 11.4.2 section 11.3