A heat map is a table visualization that uses color intensity to represent cell values. It makes patterns across groups easier to see, helping teams investigate differences in recommendation exposure or model errors. section 3.1.1 section 3.7.2
For a recommendation diagnostic, define user segments, choose attributes to compare, calculate exposure metrics, and visualize the results. Rows might represent age groups, geographies, or subscription types; columns might represent genres, languages, or other content attributes. section 3.1.1
Genre exposure by age group
Count recommendations by age group and genre, pivot the counts into a table, and normalize each row to get genre proportions. A heat map can reveal whether one age group receives a broad genre mix while another sees a narrower selection. section 3.1.1
Listing 3.1 Analyzing Distribution of Genres by Age Group Cohorts
# Calculate the distribution of genres within each age group's recommendations
genre_diversity = analysis_df.groupby(['age_group', 'genre']).size().reset_index(name='count')
genre_pivot = genre_diversity.pivot(index='age_group', columns='genre', values='count').fillna(0)
genre_pivot = genre_pivot.div(genre_pivot.sum(axis=1), axis=0)  # Normalize by row to get proportions

genre_pivot
The listing groups recommendation counts by age and genre, pivots them into a table, and normalizes each age-group row. section 3.1.1
Figure 3.2 This heatmap shows how recommendation exposure varies by age group and genre. Darker cells indicate higher exposure. The goal is not to assume every difference is a problem, but to identify patterns that may require deeper investigation.
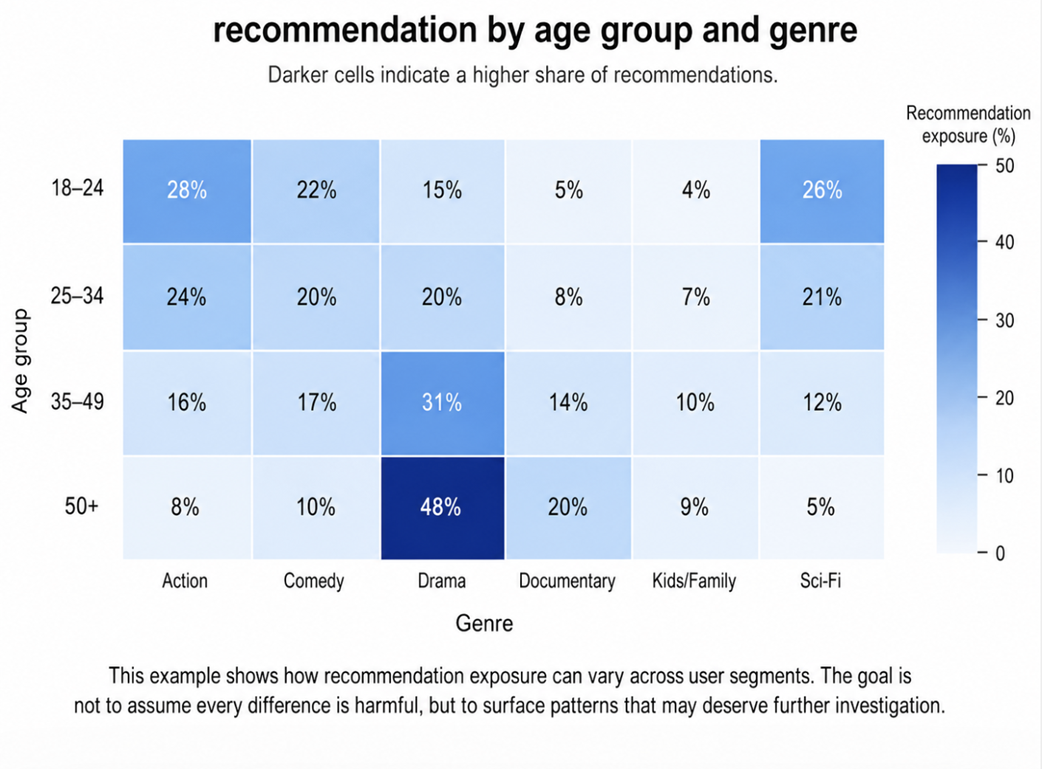
Darker cells indicate higher genre exposure for an age group, making differences across groups visible. section 3.1.1
A visible difference is a prompt for investigation, not proof of unfairness or harm. Use the diagnostic to ask whether exposure is balanced and relevant to users and aligned with product goals. Heat maps can also compare error rates across demographic groups; Plotly is one option for creating customizable diagnostic visualizations. section 3.1.1 section 3.7.2