A heat map represents numerical values through color. For Transformer activations, it makes wide neuron vectors easier to inspect by grouping neurons into bins and coloring each bin by its mean activation. section 10.2
Two layouts show different views of activation:
- Plot tokens against neuron bins to compare how a layer responds across a prompt. section 10.2.1
- Average activations across tokens, then plot layers against neuron bins to follow changes through the model. section 10.2.1
- For readable plots, bin neurons and use the 99th percentile of absolute values to set the color bound; discard the BOS token before plotting. section 10.2.1
Prompt activation view
For “The cat sleeps,” a token-by-neuron heat map uses one row per token and bins of 256 neurons per column. In the displayed layer, “cat” shows stronger responses across most bins than the other tokens. section 10.2.1
Figure 10.1 Token × neuron activation heatmap for act_fn_layer_12 on the prompt "The cat sleeps". Each row is a token, each column is a bin of 256 neurons averaged together. Activation intensity varies visibly across tokens: "cat" shows consistently stronger responses across most neuron bins, while "The" and "sleeps" remain more uniform. The BOS token has been excluded from the visualization.
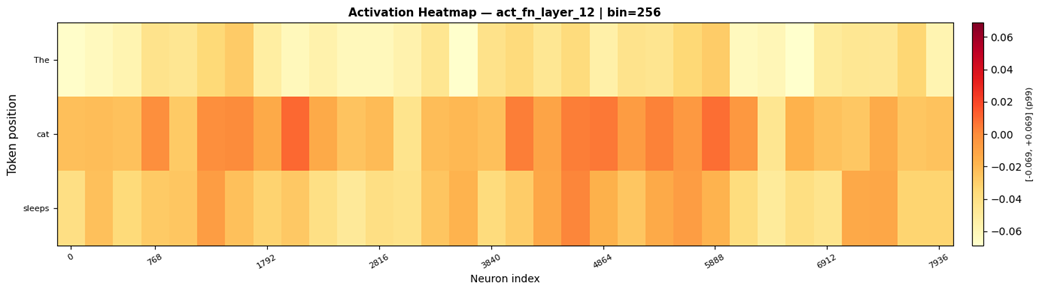
View the token-by-neuron activation pattern for the prompt “The cat sleeps.” section 10.2.1