The interquartile range (IQR) is the difference between the third quartile (Q3) and first quartile (Q1): IQR = Q3 − Q1. Quartiles split ordered values into four equal-sized ranges: Q1 marks the point below which 25% fall, the median marks 50%, and Q3 marks 75%. The interval from Q1 to Q3 contains the middle half of a data set. section 7.1.2
IQR is useful when spread should be measured without letting extreme values dominate the result. Rather than assuming a normal distribution, retain values between lower and upper quartiles, then calculate variance and standard deviation on the reduced data. This limits the effect of outliers and skewed data. section 7.1.2
Figure 7.4 Quartiles for a nonnormal distribution
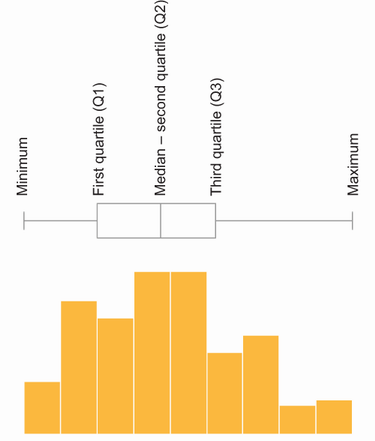
Use the box plot to locate the lower quartile, median, and upper quartile in a nonnormal distribution before deciding which values belong to the middle range. section 7.1.2
For connection-timing analysis, apply IQR as a repeatable filter:
- Group events by source IP, destination IP, and destination port, keeping groups with enough observations. section 7.1.2
- Order or process each group's time_diff_sec values and calculate lower and upper quartiles. section 7.1.2
- Drop rows below the lower quartile or above the upper quartile. section 7.1.2
- Calculate standard deviation, variance, and connection count on the retained observations; investigate low-variation patterns further. section 7.1.2
Listing 7.4 Dropping rows with values of time_diff_sec outside the IQR
df = df.drop(df[(df['time_diff_sec'] < \
    df['lower_quartile'])].index) \                          #1

df = df.drop(df[(df['time_diff_sec'] > \
    df['upper_quartile'])].index) \                          #2
This filtering step removes time_diff_sec rows outside the lower and upper quartile bounds before later statistical calculations. section 7.1.2
Separating regular Dropbox traffic from hidden C2 activity
Two endpoints showed many TCP/443 connections to a Dropbox address whose timing values fell within their IQRs and had low standard deviations. The destination initially appeared benign, but process-and-socket investigation found PowerShell connections to Dropbox infrastructure alongside genuine Dropbox.exe activity. IQR narrowed the timing data; endpoint evidence determined that compromised hosts were involved. section 7.1.3 section 7.1.4
IQR filtering is a tuning choice, not proof of maliciousness. Jittered call-home intervals may form a flatter distribution, and narrowing the retained quantile range lowers the data volume available for analysis. Check that enough samples remain, and compare several ranges—such as 20%–80%, 25%–75%, and 40%–60%—when hunting for hidden patterns. section 7.1.5






