The interquartile range (IQR) is the span from the first quartile (25th percentile) to the third quartile (75th percentile). It marks the middle 50% of a dataset, making it useful for showing where typical values concentrate without needing to show every data point. section 6.4
In a box plot, the rectangle encodes the IQR and a line crossing it marks the median. Whiskers extend from the minimum to the first quartile and from the third quartile to the maximum; points outside whiskers can be shown as outliers. This compact view emphasizes quartiles and the median, though it can be less immediately familiar than a histogram. section 6.4
To calculate and draw an interquartile range with D3:
- Find the dataset values to summarize, along with its minimum and maximum when building a box plot. section 6.4
- Use a quantile scale to calculate quartiles and the median. section 6.4
- Map the first- and third-quartile positions to SVG coordinates, then draw the box or range marker at those positions. section 6.4
The IQR can also annotate a violin plot. A violin shows the full distribution as a mirrored, smoothed shape: it widens where bins contain more values and narrows where they contain fewer. Adding a line from the first to the third quartile preserves a compact summary of the middle half, while a dot can show the mean or median. section 6.5 section 6.6
Salary distributions by role
For salary data grouped by analyst, developer, designer, scientist, and leadership roles, first isolate each role’s salaries, calculate its mean, bins, and quartiles, then draw a violin. A line spanning the first and third quartiles highlights the role’s middle salary range; a dot marks its average salary. section 6.5
Figure 6.17 Violin plots of the salary distribution of the five leading data visualization roles. Each plot is combined with a gray line extending from the first to the third quartile and a white dot positioned at the mean value.
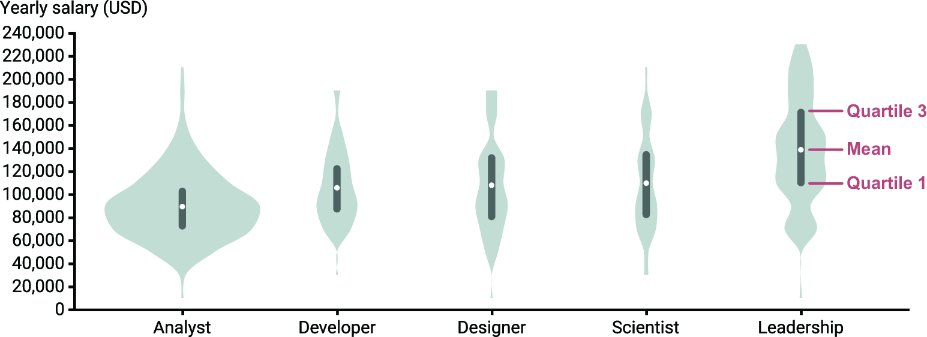
Compare the gray first-to-third-quartile line with the surrounding violin shape and the white mean marker for each role. section 6.5






