The interquartile range (IQR) measures the spread of the middle 50% of observations, from the 25th to the 75th percentile. It describes how widely the central portion of a dataset is distributed without relying on its full range. section 4.1.1
Compare the IQR with the overall range to distinguish central spread from the dataset’s full width. Together with the median, it helps describe distances between quartiles and communicate variation to stakeholders. section 4.1.1
Use the IQR to:
- Describe how close most records are to the dataset’s typical values. section 4.1.2
- Summarize skewed or asymmetrical data alongside the median, range, and a distribution visualization. section 4.1.2
- Avoid treating one summary statistic as complete: each statistic prioritizes some dataset properties and masks others. section 4.1.2
Communicating an IQR
A race summary might state that the middle 50% of participants finished between 43 and 67 minutes. This communicates the central spread more clearly than reporting only the fastest and slowest times. section 4.1.1
Figure 4.13 A boxplot shows the median and interquartile ranges in the box and the 25th and 75th percentiles in the whiskers by default. Values outside of the whiskers are typically treated as outliers.
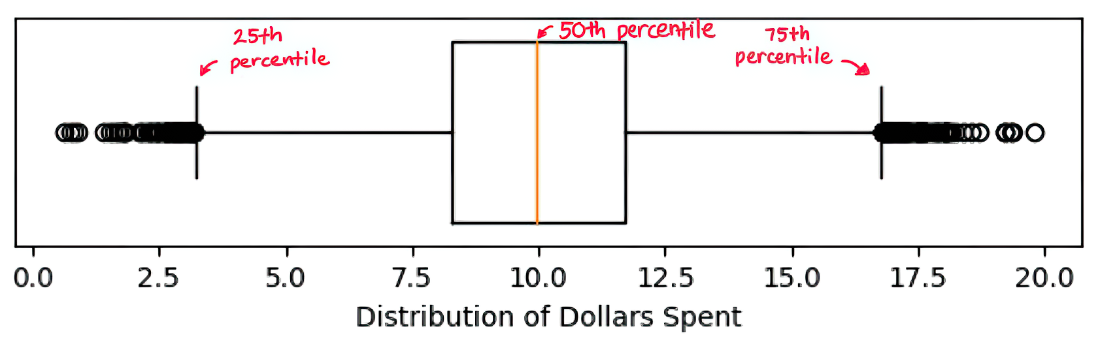
A boxplot displays the median and interquartile range in the box; its whiskers show the 25th and 75th percentiles by default, with values beyond them typically treated as outliers. section 4.1.1






