liveBook · Manning

Line plot

As explained in Digital Twins in Action

A line graph is a chart that connects data values in sequence to show changes and trends, commonly over time.

A line plot connects values in sequence to make changes over time easier to see. It is useful when a table of readings hides a trend, an unusual pattern, or a possible sensor anomaly. section 6.2.1

Plot daily sensor summaries

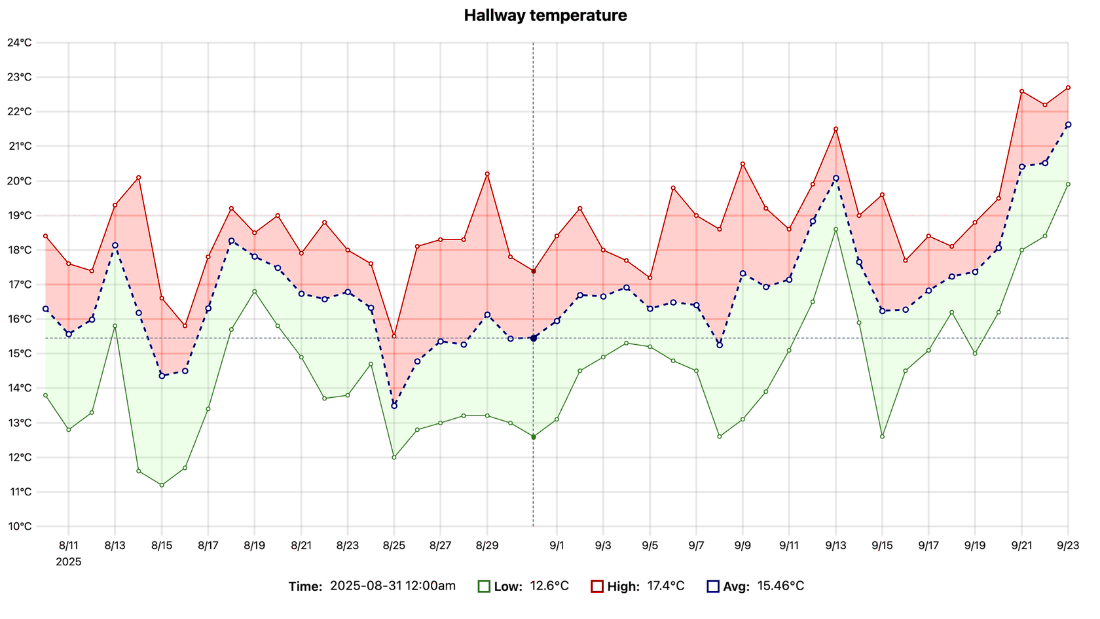
A temperature sensor produces 6,375 readings over 45 spring days. Calculate each day’s low, high, and mean, then plot those summaries against time. The mean’s upward trend and days with unusual temperatures become easier to spot than in the raw readings or summary table. section 6.2.1

Figure 6.2 Line graph of the daily mean, low, and high temperatures from a temperature sensor in my hallway over a 45-day period in spring, allowing me to monitor the sensor’s performance and detect unusual thermal patterns
figure

The figure plots daily mean, low, and high temperatures together, making the sensor’s behavior over the 45-day period visible. section 6.2.1

If the trend matters more than exact values or chart labels, use a sparkline instead. Its compact, axis-free form fits multiple sensor trends into a table. section 6.2.1


How Digital Twins in Action covers it

How deep it goes
Works through daily aggregation and a plotted example, but gives implementation code for sparklines rather than a full line graph.
Examples
Uses 6,375 temperature readings summarized across 45 days into daily lows, highs, and means.
What it assumes
Assumes familiarity with timestamped readings while demonstrating how to reduce them to daily summaries.
What you can do after
Apply it to daily sensor summaries to identify trends and unusual readings.
How it connects
Connects time-series data, daily aggregation, data visualization, sensor anomalies, and sparklines.

Also explained in

Compare how 6 books explain line plot →

Related concepts

This explainer was generated by Manning's knowledge graph from the text of Digital Twins in Action. The section links point to the parts of the book it draws on.



