A logit turns an event’s odds into a number that can be modeled additively. Odds compare an outcome with its alternative; the logit is their natural logarithm, or log-odds. In binary classification, this creates a bridge between a linear score and a probability. section 7.1.3
For a probability p, the odds are p/(1 − p), and the logit is log(p/(1 − p)). A logistic regression model sets this quantity equal to β₀ + β′x. Applying the inverse link gives p = 1/(1 + e⁻⁽ᵝ⁰ ⁺ ᵝ′ˣ⁾), the sigmoid function. The linear expression therefore controls how likely either binary class is. section 7.1.3
Reading a coefficient as an odds change
Suppose a diabetes model assigns age a weight of 0.5. Increasing age by one raises the log-odds of a positive diagnosis by 0.5 and multiplies the odds by e⁰·⁵ = 1.65, or 65% more. A glucose weight of −0.29 instead multiplies the odds by e⁻⁰·²⁹ ≈ 0.75, or 25% less. Positive weights increase the modeled odds, negative weights decrease them, and zero weights leave them unchanged. section 9.1.3
This interpretation makes logistic regression useful when feature contributions need to remain visible. Its linear and additive structure expresses the log-odds as individual weighted contributions, while the Bernoulli distribution supplies the yes/no outcome model. section 7.1.3 section 9.1.3
A practical workflow applies the idea to a classification model:
- Standardize the breast-cancer features, split the data, and fit scikit-learn’s LogisticRegression classifier. section 9.1.3
- Exponentiate learned coefficients to view multiplicative changes in odds, then compare positive, negative, and zero contributions. section 9.1.3
Figure 7.5 Logistic regression (left) fits 0/1-valued targets by assuming that the spread of the targets can be modeled by the discrete-valued Bernoulli distribution (right). Observe how the prediction probabilities (the heights of the bars) of Class 0 and Class 1 change with the data.
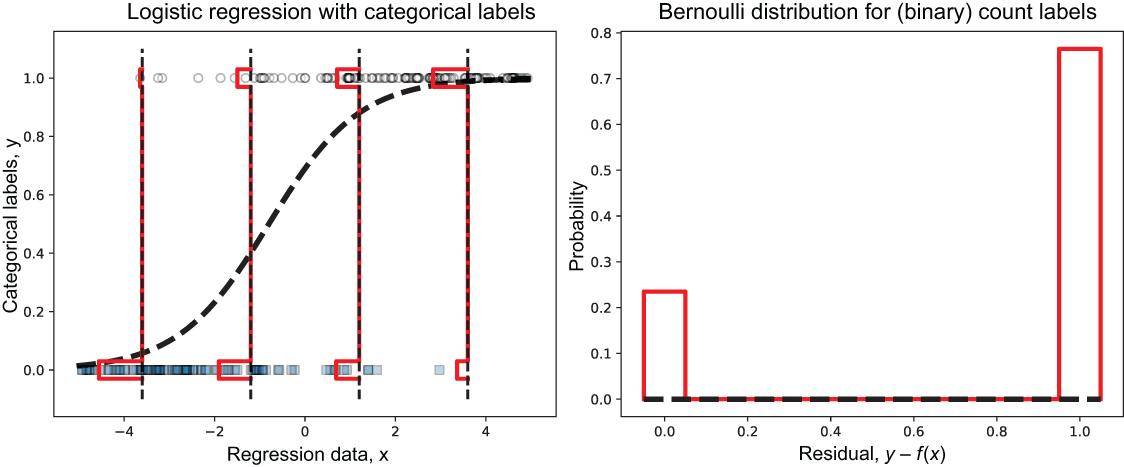
Visualize how the sigmoid maps one feature to changing class probabilities while the Bernoulli distribution represents the binary outcomes. section 7.1.3