The logit turns a probability into the natural logarithm of its odds: first compute p/(1−p), then take ln of that result. Unlike probability, log-odds can range across the whole number line. section 8.4
Use the logit to connect probability, odds, and logistic regression:
- Probability describes how likely an event is; odds compare its likelihood with its non-occurrence. section 8.4
- The logit of a logistic-function output matches the model’s linear component, β0 + β1x. section 8.4
- An odds ratio describes how the odds change per unit of x, making model effects easier to compare. section 8.4
A toddler-meltdown risk
At four hours, a logistic model gives a meltdown probability of about 0.8532. Its odds are about 5.813 to 1; taking the natural logarithm of those odds produces the same value as β0 + β1x. section 8.4
Figure 8.6 Comparing the logistic function (the S-curve) with the log-odds function (the straight line). Note that when the log-odds line crosses y = 0, the sigmoid function has a value of y = 0.5.
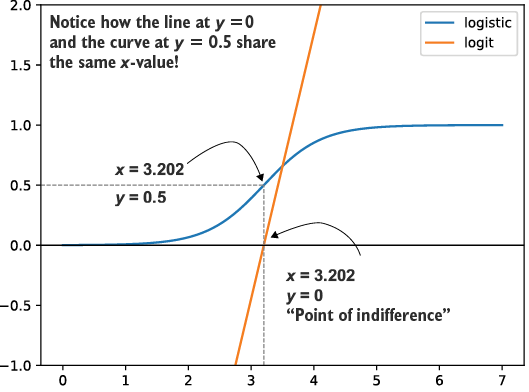
Compare the logistic S-curve with the straight log-odds line; where the line crosses zero, the logistic function equals 0.5. section 8.4