Mean absolute error (MAE) measures the average absolute difference between predicted and actual values. Because over- and underestimates both count as positive errors, MAE expresses average prediction error in the same units as the target. section 4.5.4 section 4.5.5
An average is not a guarantee for any individual prediction. A model with an MAE of 77.50 INR can still miss a particular price by hundreds of rupees. Compare MAE with root mean squared error (RMSE), which penalizes large errors more heavily, and inspect predicted-versus-actual plots for patterns that a single average hides. section 4.5.5
Listing 4.5 Evaluating the model’s performance
Y_pred = model.predict(X_test)

r2 = r2_score(Y_test, Y_pred)
mae = mean_absolute_error(Y_test, Y_pred)
rmse = np.sqrt(np.mean((Y_test - Y_pred)**2))
This test-set evaluation computes MAE from actual and predicted values alongside R² and RMSE. section 4.5.4
Drug-price prediction
A random forest model produced an MAE of 77.50 INR and an RMSE of 179.69 INR. A revised model reduced MAE to 57.98 INR, roughly 25% lower, while RMSE rose slightly and R² fell. The lower average error is useful, but it does not establish that the model improved on every criterion. Because several changes were combined, isolated tests would be needed to assess their individual contributions. section 4.5.5 section 4.5.6
Figure 4.8 Predicted vs. Actual Drug Price: This visualization compares actual drug prices against the model's predictions. The dashed identity line represents perfect accuracy, while the blue dots show real-world performance. The plot illustrates a high concentration of accurate predictions for low-cost medications, with increasing variance and under-prediction as actual drug prices rise.
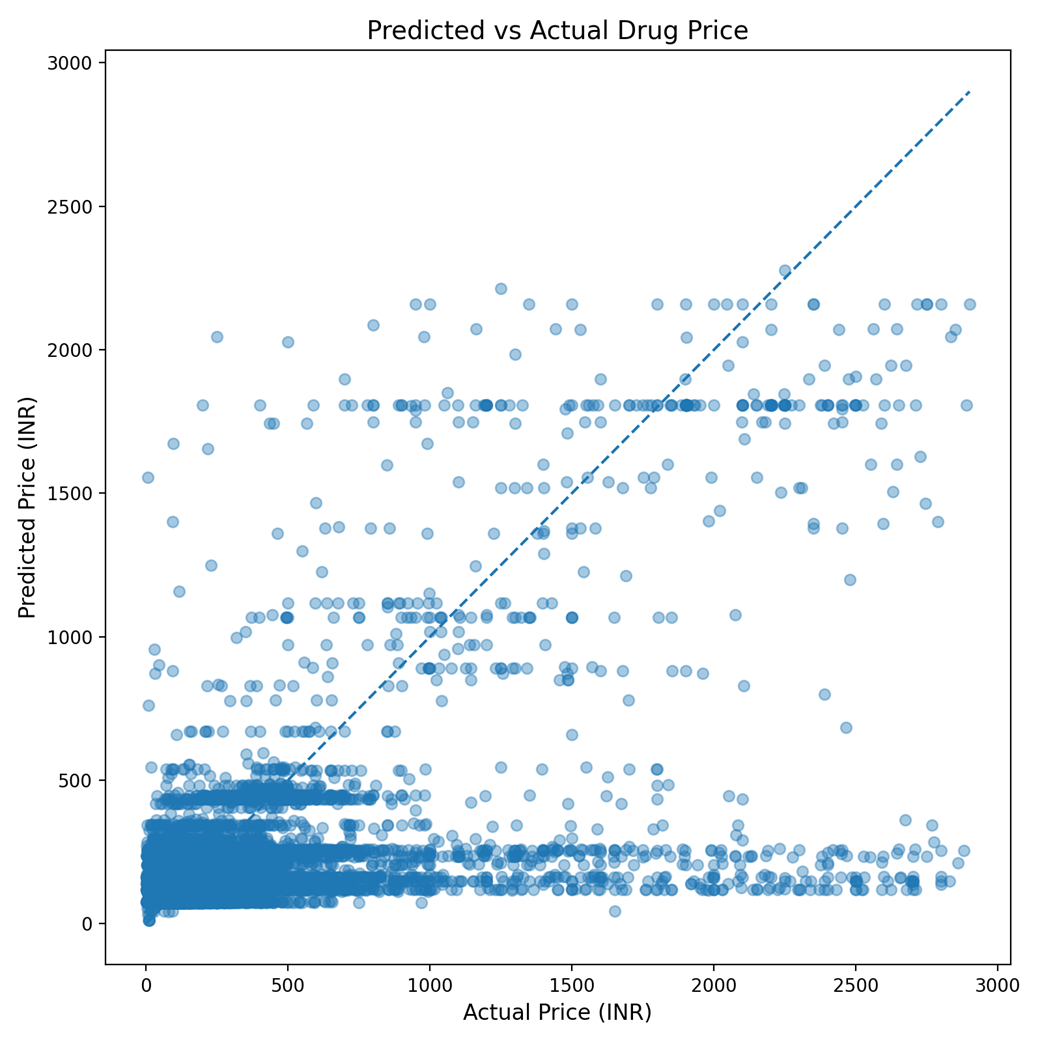
The predicted-versus-actual plot shows increasing variation and underprediction as actual prices rise, revealing behavior that MAE alone does not show. section 4.5.5