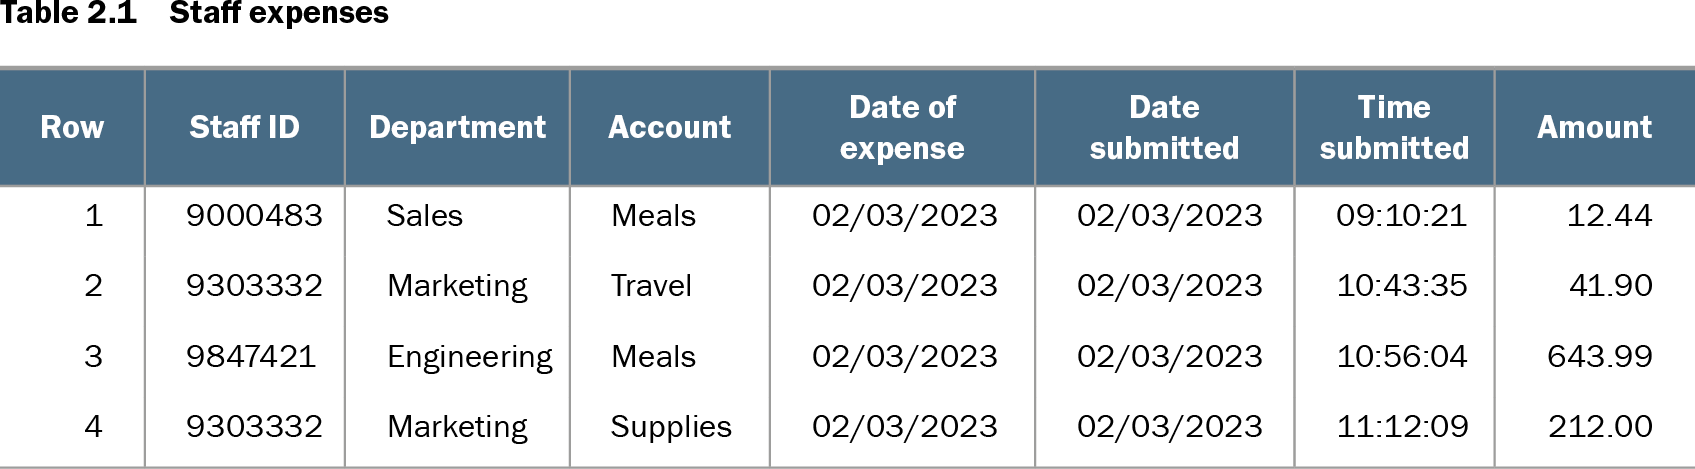
Quantitative data consists of numerical quantities that can be compared and used in calculations. In a staff-expenses table, Amount is quantitative; Staff ID is categorical even though its entries look like numbers. The distinction depends on what a value represents, not just how it is written. section 2.0
Table 2.1 Staff expenses (view table figure)
| Row |
Staff ID |
Department |
Account |
Date of expense |
Date submitted |
Time submitted |
Amount |
|---|---|---|---|---|---|---|---|
| 1 |
9000483 |
Sales |
Meals |
02/03/2023 |
02/03/2023 |
09:10:21 |
12.44 |
| 2 |
9303332 |
Marketing |
Travel |
02/03/2023 |
02/03/2023 |
10:43:35 |
41.90 |
| 3 |
9847421 |
Engineering |
Meals |
02/03/2023 |
02/03/2023 |
10:56:04 |
643.99 |
| 4 |
9303332 |
Marketing |
Supplies |
02/03/2023 |
02/03/2023 |
11:12:09 |
212.00 |
Compare Amount with Staff ID, Department, and Account to see why a numeric-looking identifier is not a quantitative feature. section 2.0
Numeric columns support statistical tests applied one column at a time. They also serve as inputs to distance-based, density-based, and cluster-based outlier detectors, which treat rows as points in a space. These detectors require numeric features on comparable scales: otherwise, columns with larger scales can dominate distance calculations. Min-max scaling and standardization are common choices. Pairwise-distance methods can also struggle when the dataset has very many features. section 2.0 section 3.2
Real tables often mix numeric and categorical columns, while many detectors accept only one type. A numeric detector generally requires categorical columns to be encoded, for example with one-hot or ordinal encoding. A categorical detector instead requires numeric columns to be binned. Choosing a numeric detector therefore does not remove the need to prepare the other columns. section 3.3.2 section 4.15
Scoring numeric values with HBOS
Histogram-based Outlier Score (HBOS) divides each numeric feature into equal-width bins and counts the training records in each bin. A value in a sparsely populated bin receives a higher outlier score; the row score combines scores across its features. Thus a rare value need not be at an extreme: an internal bin can also be sparse. The worked three-feature row [10.0, 453.1, 0.003] is scored value by value before those scores are summed. section 6.2
Listing 6.4 Using HBOS with the speech dataset
import pandas as pd
from pyod.models.hbos import HBOS
from sklearn.datasets import fetch_openml
import matplotlib.pyplot as plt
import seaborn as sns

data = fetch_openml(“speech”, version=1, parser='auto')
df = pd.DataFrame(data.data, columns=data.feature_names)
print(df.head())

det = HBOS()
det.fit(df)
pred = det.decision_scores_

sns.histplot(pred)
plt.show()
The Python example fits PyOD’s HBOS detector to a numeric speech dataset and plots the resulting row-score distribution. section 6.2
A high score flags a row for investigation, not an automatically meaningful anomaly. Representative data matters, and evaluating detector results often requires manual inspection. Scaling choices can change distance-based results, yet labeled data for testing those choices is usually unavailable. section 4.15 section 3.2