A percentile is a quantile expressed on a 0–100 scale: it identifies a value below which a specified proportion of observations falls. For latency, p95 is the 95th percentile—the threshold at or below which approximately 95% of measured requests fall. It captures a slower part of the distribution rather than the average. section 11.5 section 8.4
Set user-facing latency targets on end-to-end p95, including preprocessing and postprocessing. Track inference-only latency separately as a diagnostic: a faster model may not improve the full path much if decoding or feature preparation dominates. On edge devices, measure under sustained load as well as at cold start, and record the measurement source. section 11.5 section 11.6
A vision pipeline’s latency budget
An on-device vision pipeline measured 9 ms end-to-end p95 against a one-second target. JPEG decoding accounted for about 60% of per-image cost, while the Core ML forward pass accounted for 17.7%. The end-to-end percentile establishes whether the target was met; the stage breakdown identifies where further optimization matters. section 12.5
Quantiles also help choose numerical representation levels. NF4 places 16 quantization levels using normal-distribution quantiles, concentrating levels near zero and spacing them farther apart in the tails. Its codebook reserves zero and uses seven negative and eight positive levels; within each side, uniformly spaced quantiles cover equal probability mass. This distribution-matched placement aims to reduce weight quantization error rather than measure latency. section 8.4 section 8.1
Figure 8.12 NF4, INT4 uniform, and FP4 E2M1 quantization levels in [-1, 1]. NF4 (top row) clusters its levels near the center, matching the normal distribution's density. INT4 (middle) spaces levels uniformly. FP4 (bottom) clusters near zero via its exponential spacing. NF4 and FP4 each place 7 levels in [-0.3, 0.3]; INT4 places only 4.
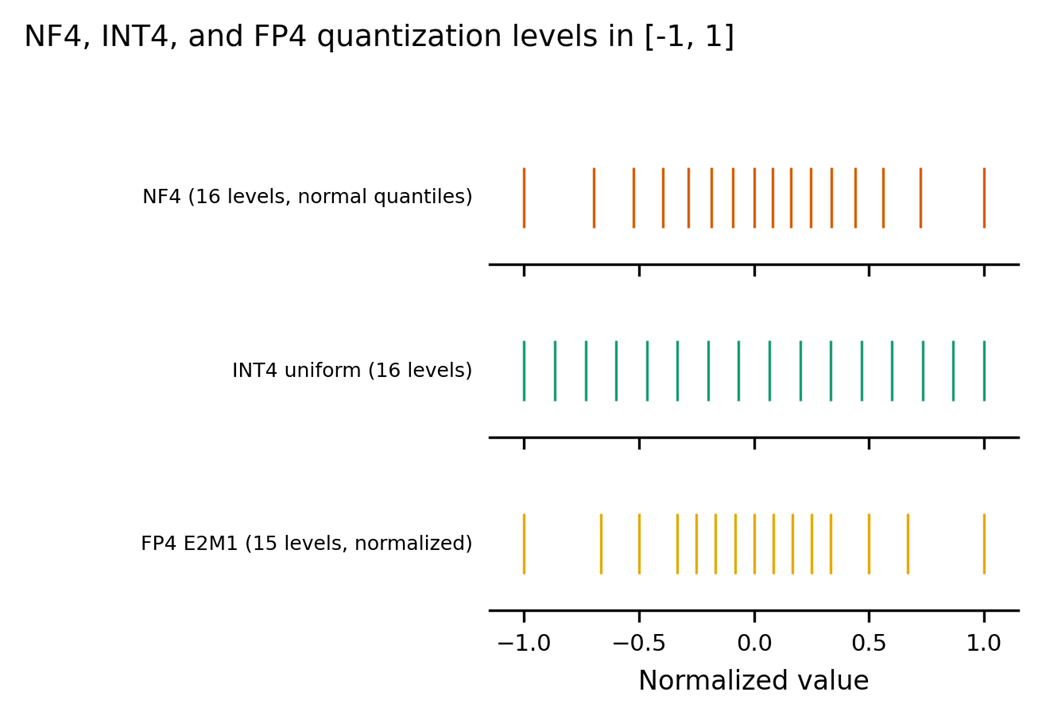
Compare NF4’s quantile-derived levels with uniform INT4 and floating-point FP4 spacing. section 8.4