liveBook · Manning

Poisson distribution

As explained in Applied Reinforcement Learning

The Poisson distribution gives the probability of a count of independent events occurring during a fixed interval at a roughly constant average rate.

Use the Poisson distribution to model counts of independent events arriving at a roughly constant average rate. In production planning, it can represent uncertain customer orders or machine breakdowns. section 2.5

Urgent orders

If a scooter line averages five rush orders per day, estimate λ from historical data and use it to assess the chance of eight or more orders. Simulating demand spikes can help weigh extra inventory against unmet orders. section 2.5

Listing 2.5 Stochastic demand dynamic (Transition function)
def sample_demand(params: FactoryProblemDefinition): #A
    demand_scooter = np.random.poisson(params.lambda_scooter)    #B
    demand_bike = np.random)poisson)params.lambda_bike)    #B
    return demand_scooter, demand_bike

The demand-sampling function uses NumPy's Poisson sampler with product-specific λ values. section 2.5
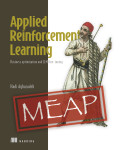

How Applied Reinforcement Learning covers it

How deep it goes
Explains the event-rate assumption, λ as mean and variance, historical estimation, and simulation without deriving the distribution.
Examples
Uses daily rush orders averaging five and considers the likelihood of eight or more orders.
What you can do after
Apply it via NumPy's Poisson sampler to simulate demand spikes and weigh inventory buffers against unmet orders.
How it connects
Connects stochastic demand modeling with Markov decision processes and the Normal distribution.

Also explained in

Compare how 8 books explain Poisson distribution →

Related concepts

This explainer was generated by Manning's knowledge graph from the text of Applied Reinforcement Learning. The section links point to the parts of the book it draws on.