liveBook · Manning

Precision

As explained in Machine Learning Algorithms in Depth

The proportion of positive predictions that are correct.

Precision measures the proportion of positive predictions that are correct. For a binary classifier, precision is computed as Precision = TP/(TP + FP), where TP counts true positives and FP counts false positives. section 5.2

Changing the classification threshold changes TP, FP, FN, and TN, so precision describes performance at a particular threshold rather than a fixed property of the classifier. section 5.2

Use precision with related evaluation views:

  • Plot precision against recall across thresholds to form a precision-recall curve. section 5.2
  • Combine precision and recall at a fixed threshold with the F1 score, their harmonic mean: F1 = 2PR/(P + R). section 5.2
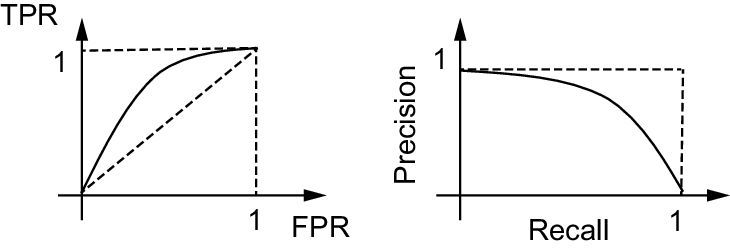
Figure 5.4 Receiver operating characteristic (ROC) plot (left) and precision-recall plot (right)
figure

Compare ROC and precision-recall plots to see how threshold changes trace classifier performance. section 5.2


How Machine Learning Algorithms in Depth covers it

How deep it goes
Defines the formula and relates it to thresholds, precision-recall curves, and F1, without deriving classifier internals.
Examples
Uses confusion matrices and threshold-varying ROC and precision-recall plots as evaluation artifacts.
What it assumes
Assumes binary classification and confusion-matrix terms while defining true-positive and false-positive contributions.
What you can do after
Evaluate/understand classifier performance by computing precision and comparing it across classification thresholds.
How it connects
Connects precision to confusion matrices, recall, classification thresholds, precision-recall curves, ROC curves, and F1 score.

Also explained in

Compare how 20 books explain precision →

Related concepts

This explainer was generated by Manning's knowledge graph from the text of Machine Learning Algorithms in Depth. The section links point to the parts of the book it draws on.

















