Principal component analysis (PCA) is an unsupervised method for reducing the number of features in a dataset. It projects data onto new, orthogonal directions called principal components, ordered by how much variance they explain. Keeping the first few components compresses the data while retaining as much variance as possible for that number of components. section 6.2.3
For example, imagine points spread widely along one direction but barely varying along another. Projecting them onto the first direction produces a simpler, one-dimensional representation. PCA finds such directions even when they do not align with the original axes. section 6.2.3
Figure 6.9 PCA defines a new coordinate system based on principal components, where the important dimensions are self-evident, and we can reduce the data dimensionality to k by retaining the first k PCs as ranked by the amount of variance they explain.
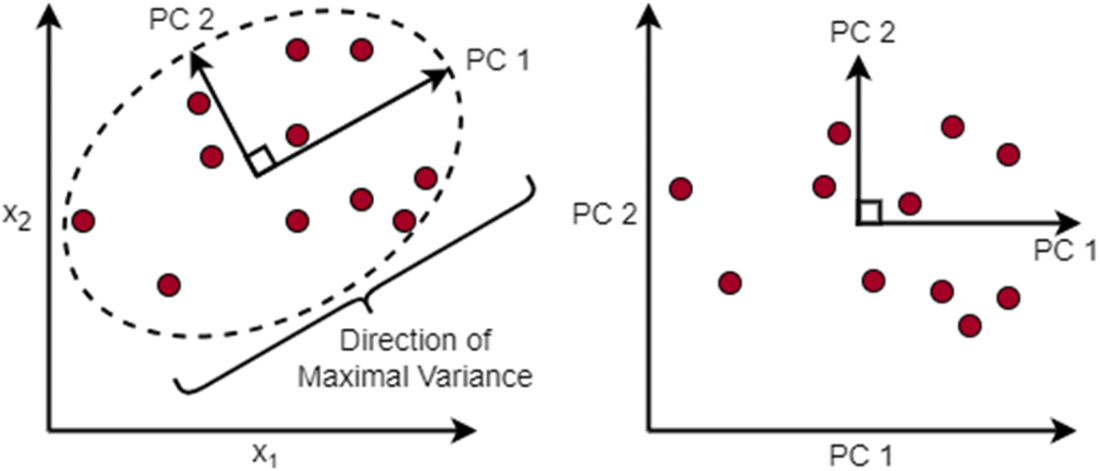
See how principal components form new axes and how retaining the first k components reduces dimensionality. section 6.2.3
Choosing how many components to keep balances compression against retained variation. A scree plot is one aid, but its suggested cutoff can be subjective. High variance is not a guarantee of predictive importance: small variations can sometimes matter too. section 6.2.3
Exploring drug molecules
RDKit can turn drug structures into Morgan fingerprints: numerical representations of molecular features. Scikit-learn PCA can then compress those fingerprints into four components for exploring chemical space. The listing constructs 1,024-feature fingerprints and uses PCA(n_components=4, random_state=42) followed by fit_transform(X). section 1.2.3
Listing 1.2 Example Applications with USAN Stems
from rdkit.Chem.rdFingerprintGenerator import GetMorganGenerator
from sklearn.decomposition import PCA
from sklearn.linear_model import LogisticRegression

fda_approved_df = pd.read_csv(
    'data/fda_approved_drugs/fda_approved_drugs.csv', sep=','
)
PandasTools.AddMoleculeColumnToFrame(
    fda_approved_df, smilesCol='Smiles', molCol='ROMol'
)
fda_approved_df = fda_approved_df[~fda_approved_df['ROMol'].isnull()]
morgan_gen = GetMorganGenerator(radius=3, fpSize=1024)
fda_approved_df['ECFP6'] = fda_approved_df['ROMol'].apply(
    lambda mol: morgan_gen.GetFingerprint(mol)
)

X = np.array([x for x in fda_approved_df['ECFP6']])
pca = PCA(n_components=4, random_state=42)
pca_drugs = pca.fit_transform(X)
fda_approved_df['PC1'] = pca_drugs.T[0]
fda_approved_df['PC2'] = pca_drugs.T[1]
fda_approved_df['PC3'] = pca_drugs.T[2]
fda_approved_df['PC4'] = pca_drugs.T[3]

sns.pairplot(
    fda_approved_df,
    hue='USAN Stem',
    vars=['PC1', 'PC2', 'PC3', 'PC4'],
    palette='viridis'
)

fda_approved_df['cillin'] = (
    fda_approved_df['USAN Stem'] == '-cillin'
).astype(int)
fda_approved_df['olol'] = (
    fda_approved_df['USAN Stem'] == '-olol'
).astype(int)

lr_model_cillin = LogisticRegression()
lr_model_cillin.fit(fda_approved_df[['PC1', 'PC3']], fda_approved_df.cillin)

xx = np.mgrid[fda_approved_df.PC1.min():fda_approved_df.PC1.max():.01
yy = fda_approved_df.PC3.min():fda_approved_df.PC3.max():.01]
grid = np.c_[xx.ravel(), yy.ravel()]
probs = lr_model_cillin.predict_proba(grid)[:, 1].reshape(xx.shape)
Follow the fingerprint preparation and PCA calls in the drug-molecule workflow. section 1.2.3
PCA can also reduce molecular descriptor data in a quantitative structure–activity relationship (QSAR) workflow for small molecules binding to RNA. The workflow pairs dimensionality reduction with representative data splitting using the Kennard–Stone algorithm. section 6.0 section 6.2.3