Sampling selects observations for modeling, but random selection can miss important differences in how data is distributed across a range. section 6.1.3
Use exploratory analysis to make sampling decisions:
- Inspect plots for uneven dispersal, especially where behavior differs between lower and upper value ranges. section 6.1.3
- Check whether the selected observations preserve meaningful distributions, such as readings across the days of a year. section 6.1.3
Tips, bills, and sensor readings
A tips-versus-bills plot reveals different dispersal patterns for mid-sized and larger bills. A sensor-reading count by day exposes the expected lower frequency of leap day, helping validate coverage before modeling. section 6.1.3
Figure 6.2 Tips versus bills (checks) at a restaurant from the Wikipedia EDA page. By Visnut, own work, CC BY-SA 3.0, https://commons.wikimedia.org/w/index.php?curid=25703576
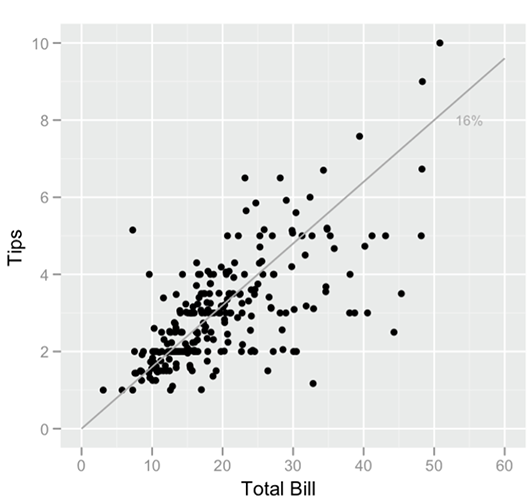
Use the tips-versus-bills plot to see why a random sample may fail to represent important regions of a data set. section 6.1.3