A regression coefficient estimates how a predictor relates to a response. In linear regression, a predictor’s coefficient gives the expected change in the numeric response for a one-unit increase in that predictor; its sign gives the direction of the relationship. In multiple regression, interpret that change with the other model terms held fixed. section 4.0 section 4.2.3 section 5.1
For a simple linear regression, write the prediction as ŷ = a + bx. The slope b equals Σ(x − x̄)(y − ȳ) / Σ(x − x̄)²; the intercept a equals ȳ − bx̄ and gives the predicted response at x = 0. These estimates define the fitted line, but they do not establish by themselves that its predictions are reliable. section 4.2.3 section 4.0
Predict a race split time
A fitted model predicts Stage 2 running time from Stage 1 time: ŷ = −3.078 + 1.3083x, with times in minutes. For x = 193, Python’s round(-3.078 + 1.3083 * 193) gives 249 minutes. The positive slope associates a one-minute longer Stage 1 time with about 1.31 additional predicted Stage 2 minutes. The reported R² is about 0.575; evaluate fit and assumptions before relying on the prediction. section 4.2.3 section 4.0
Figure 4.5 A scatter plot that displays the observed stage1 and stage2 values from the mds data frame, their respective x and y coordinates, and a regression line that represents the predictions for stage2 from a simple linear regression where stage2 was regressed against stage1. The regression line is drawn by applying the linear equation at the top of the plot. R-squared is one of several metrics contained in the model output; it represents the percentage of variance in stage2 that can be explained by changes in stage1.
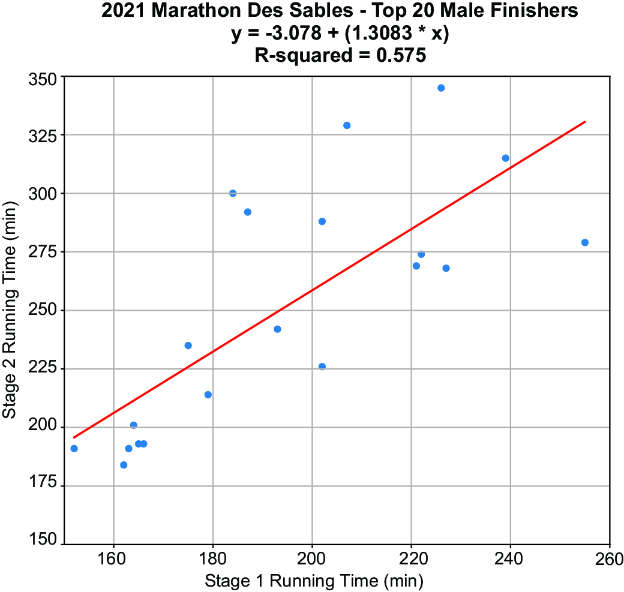
The observed race times and fitted line show what the coefficients predict—and how observations vary around those predictions. section 4.2.3
In logistic regression, coefficients have a different scale: a one-unit predictor change corresponds to a change in the log odds of a binary outcome, not a direct change in its probability. The predictors and coefficients form the input to a sigmoid function, which produces a probability between 0 and 1. For either model, consider statistical significance, collinearity and model assumptions alongside coefficient size. section 5.1 section 4.0




