An entity-relationship diagram (ERD) turns a flat schema into a visual model of the business: entities become visible as central tables and branches, while relationships reveal how records connect. This makes a hostile schema easier to navigate than reading its models alphabetically. section 7.0 section 7.4
Read an ERD as a map rather than a complete reference:
- Find the central entity and follow its relationship branches to discover the product's main story. section 7.4
- Use the diagram alongside a narrative walkthrough: the story explains why entities exist, while the ERD exposes the system's shape. section 7.4
- Trace one user action across related tables when the diagram must answer an operational question rather than merely show structure. section 7.0
A scheduling system
A Cal.com-style ERD places User near the center. User connects to EventType, Schedule, and Availability; Bookings fill available slots and connect to Attendees. Teams, Workflows, BookingAudit, Credentials, and Payments form surrounding branches. This view quickly suggests where to investigate when adding an export or tracing a booking. section 7.4
Figure 7.1 One Prisma schema, viewed four ways: as a relationship graph clustering 119 models around the Booking table; as a swim-lane diagram tracing a user action across tables; as a detailed view of a single table's columns and indexes; and as a history reconstructed from its migration files.
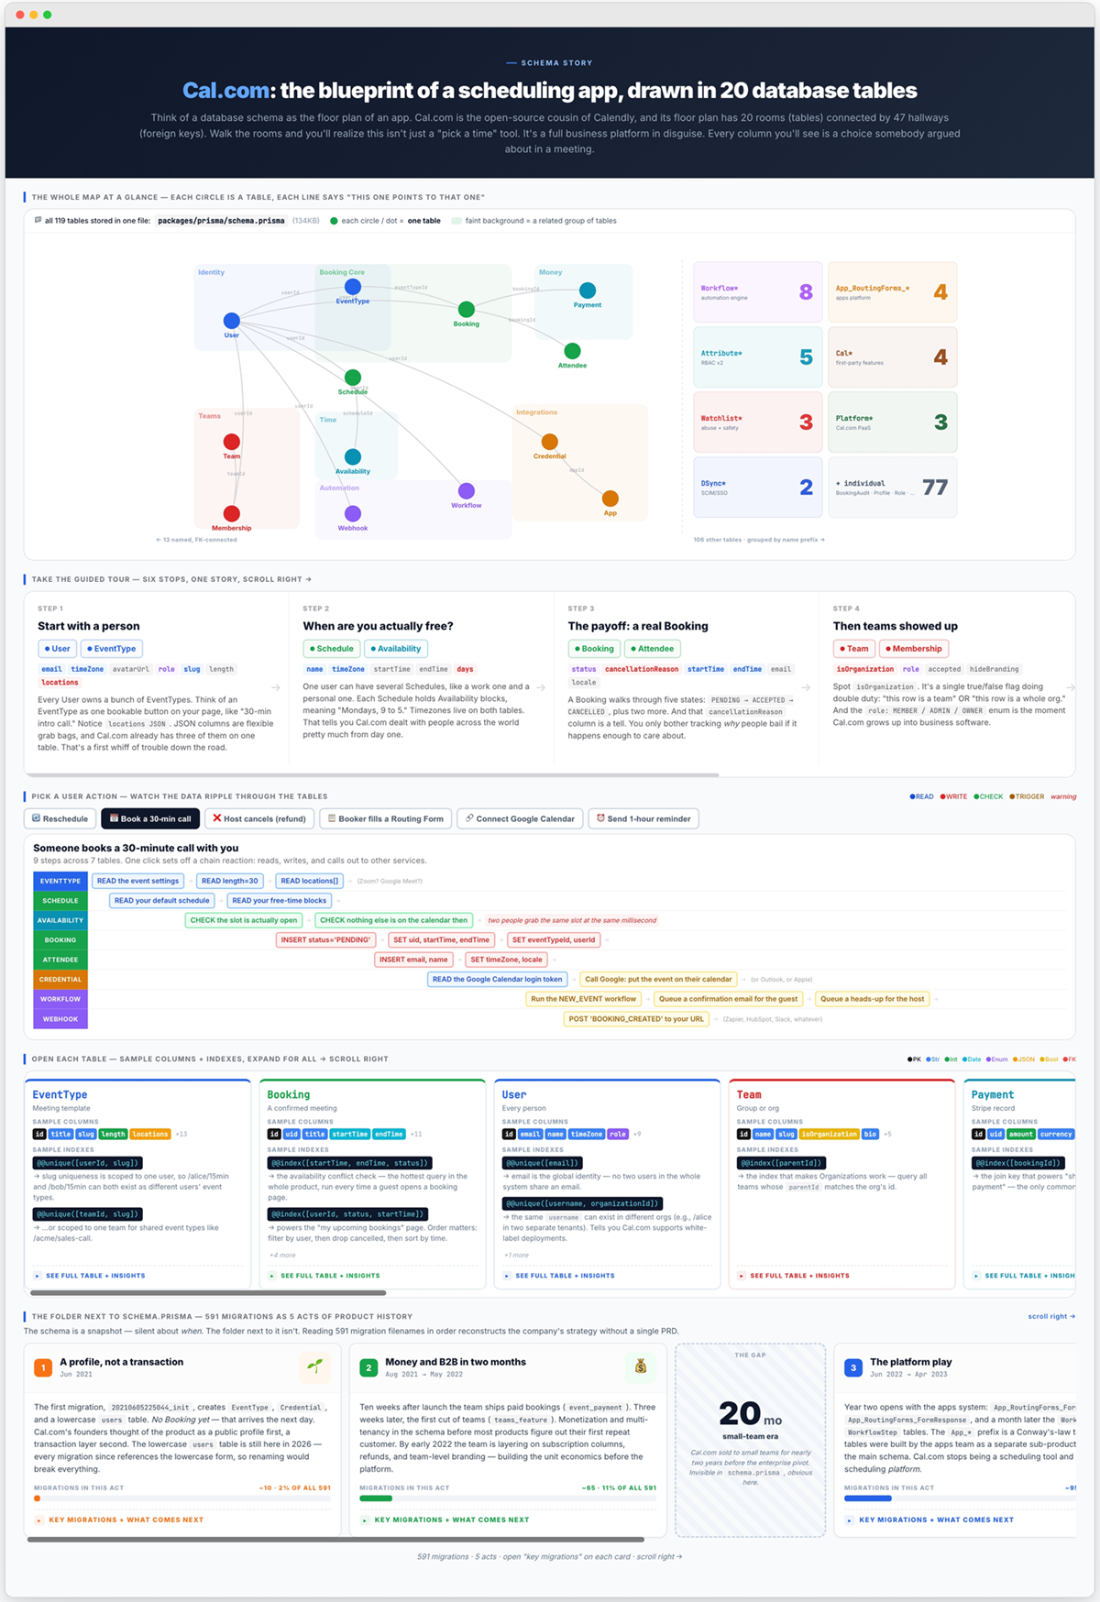
Use the four-view schema figure to compare a relationship graph, a user-action swim lane, a detailed table view, and migration history. section 7.0