Reliability is the consistency, stability, and repeatability of a measurement across repeated observations, items, respondents, raters, or conditions. Reliable measures produce similar results when the underlying concept and conditions remain consistent. Reliability supports trustworthy analytics and stakeholder decisions, but it works alongside validity: a measure must also reflect the concept or process it is intended to assess. section 6.3.1 section 6.3
Assess reliability according to how the measure is used:
- Test-retest reliability checks whether the same individuals produce similar scores over time, assuming the measured concept has not changed. Analysts collect measurements at multiple intervals, structure comparable records, and compare correlations such as Pearson’s or Spearman’s. section 6.3.1
- Inter-rater reliability checks how consistently different raters evaluate qualitative material or identify the same topics. section 6.3.1
- Internal consistency checks whether multiple variables measure the same underlying construct; Cronbach’s alpha provides one way to calculate it. section 6.4 section 6.3.1
Applying reliability checks
For an employee well-being project, assess the reliability of measures covering workplace stress, supervisor support, and workplace satisfaction. For measures intended to track change, compare responses across time; for qualitative evaluations, compare raters; for multi-item scales, examine internal consistency. Similar checks can support behavioral measures as well as self-report questionnaires. section 6.3.3 section 6.3
Figure 6.12 Test-retest reliability correlations are expected to be quite high across time periods (e.g., T1, T2, T3), often with an r value above 0.7.
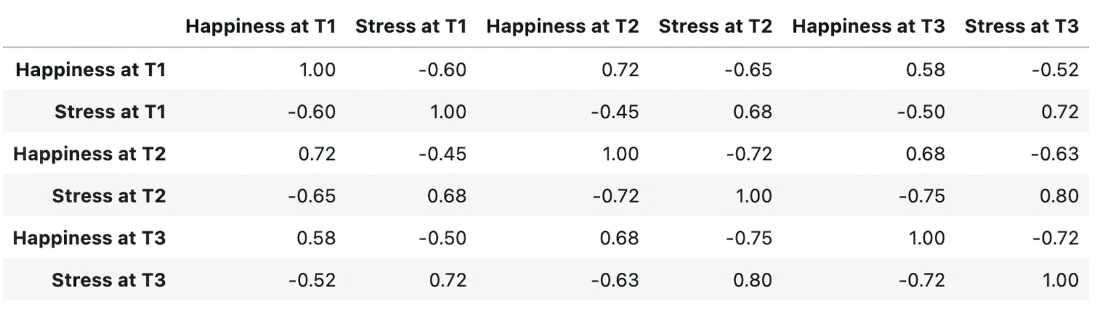
Use the figure to interpret test-retest reliability visually: correlations are expected to remain high across time periods such as T1, T2, and T3, often above r = 0.7. section 6.3.1