Which product categories bring in the most sales money, and does the answer change across Brazilian states? Revenue means income from sales before subtracting costs and expenses. In this analysis, summed item prices serve as the revenue measure; counting sales volume answers a different question. section 3.3.1
import pandas as pd

# Read DataFrames
df_products = pd.read_csv('df_products.csv')
df_product_category_translation =
pd.read_csv('df_product_category_translation.csv')
df_order_items = pd.read_csv('df_order_items.csv')
df_orders = pd.read_csv('df_orders.csv')
df_customers = pd.read_csv('df_customers.csv')

# Merge DataFrames
df_products_merged = df_products.merge(
df_product_category_translation, on='product_category_name',
 how='left')
df_order_items_merged = df_order_items.merge(
df_products_merged, on='product_id', how='left')
df_orders_merged = df_orders.merge(
df_customers, on='customer_id', how='left')
df_merged = df_order_items_merged.merge(
df_orders_merged, on='order_id', how='left')

# Calculate sales volume and revenue per category
category_sales = df_merged.groupby(
['product_category_name_english', 'customer_state']).agg(
{'order_id': 'count', 'price': 'sum'}).reset_index()
category_sales.columns =
['product_category', 'customer_state', 'sales_volume', 'revenue']

# Sort by sales_volume and revenue
category_sales_sorted = category_sales.sort_values(
by=['sales_volume', 'revenue'], ascending=False)

# Display the results
print("The most popular product categories
in terms of sales volume and revenue are:")
print(category_sales_sorted.head(10))

print("\nSales performance across different regions in Brazil:")
sales_by_region =
category_sales_sorted.pivot_table(
index='product_category',
columns='customer_state',
values=['sales_volume', 'revenue'], fill_value=0)
print(sales_by_region)
The Python workflow joins order items to product categories, orders, and customers, then groups by category and customer state. It counts order-item records for sales volume and sums `price` for revenue. Check the resulting column names before plotting: the aggregation alone does not create columns named `sales_volume` and `revenue`. section 3.3.1
A useful AI request is: “Show sales volume and revenue by product category and Brazilian state.” Inspect the reply before running it. One proposed answer instead calculated average product price, freight value, and payment value—and referred to an undefined `merged_data` DataFrame. Those averages may help investigate performance, but they do not answer which categories generate the most revenue. Verify the input DataFrame, grouped columns, and calculations against the underlying records. section 3.3.2
Figure 3.2 Heatmap of sales revenue by product category and region
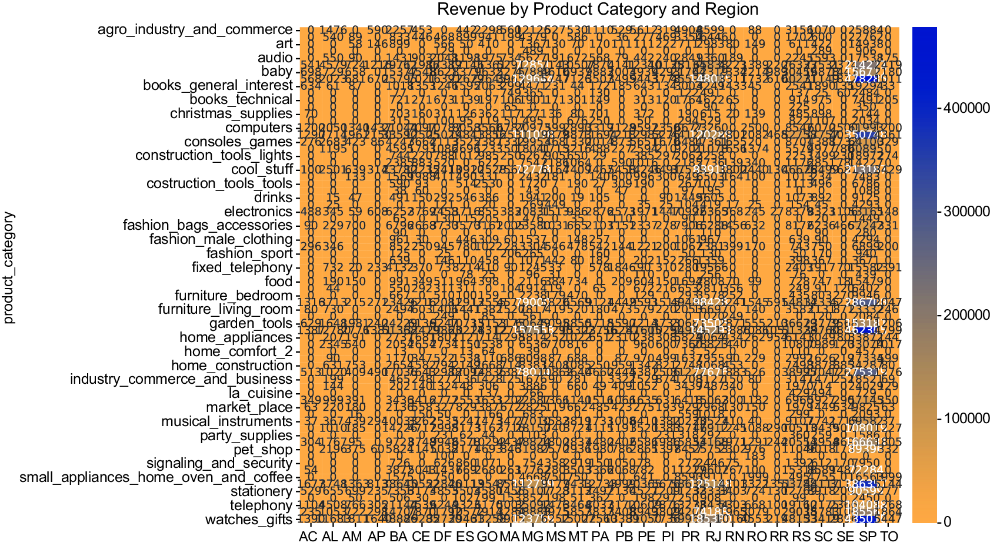
A revenue heatmap offers a way to compare categories across regions after the grouped results and plotting inputs have been checked. section 3.3.1


