Revenue measures the total income generated by selling a product before deductions or expenses. In product analysis, it ranks financial performance alongside sales volume, popularity, conversion, and change over time. section 4.2.1 section 4.4.2
When event data records product purchases and prices but omits shipping, wholesale costs, and tax, revenue is calculated as gross income: the sum of purchase prices for each product. section 4.4.2
A practical revenue analysis typically:
- Aggregates purchase-level events to one row per product. section 4.4.2
- Separates November and December revenue to compare performance during the Christmas period. section 4.2.1 section 4.4.2
- Sorts products by revenue to create a ranking, while explaining why revenue was chosen and what it leaves out. section 4.3
Product revenue league table
Filter events to purchases, assign each purchase to November or December, sum prices by product and month, and merge the result with volume, unique buyers, and conversion metrics. A high-revenue product may rank well financially while appearing less attractive on other measures if its price is high. section 4.4.2 section 4.3
Figure 4.23 A snapshot of the purchases league table data
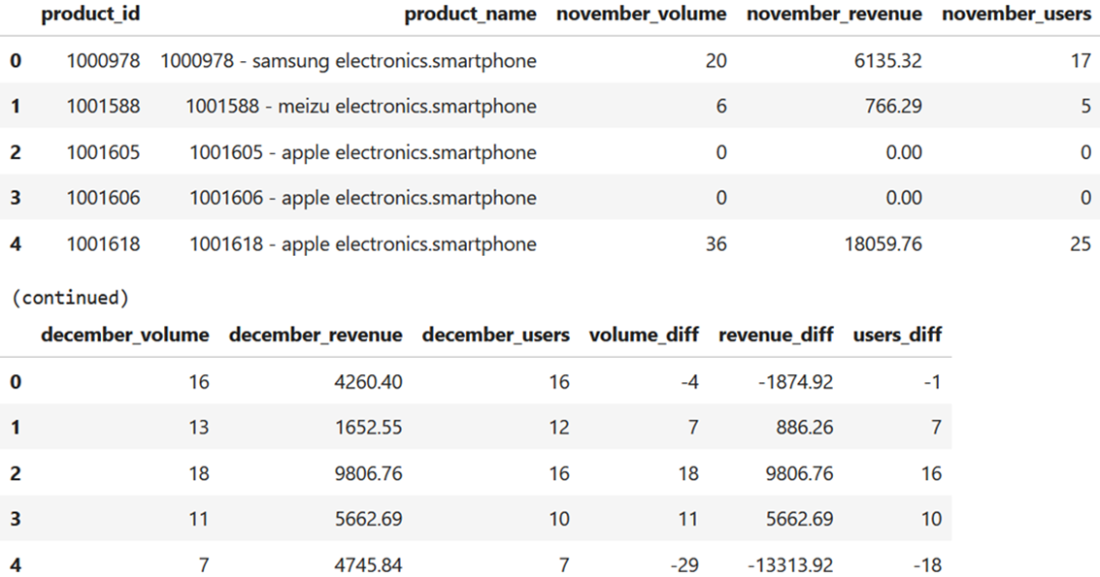
Inspect a snapshot of the product-level purchases league table used to compare monthly revenue and related measures. section 4.4.2


