Risk assessment identifies, analyzes, and evaluates threats and vulnerabilities in a defined part of an organization. It considers likelihood, exploitability, and potential business effects so that security teams can prioritize controls and identify residual risk. The goal is not merely to find problems; it is to direct effort toward risks that matter to operations and business objectives. section 6.3 section 6.0
A repeatable assessment starts with a clear boundary:
- Set the scope—such as a product, change, critical asset, location, or organization—and identify the systems and data within it. This keeps related systems from expanding the assessment indefinitely. section 6.3.1
- Identify realistic threats and relevant vulnerabilities. CVE records can help with publicly reported software and hardware flaws, but may not capture problems in custom or internal systems. section 6.3.1
- Evaluate likelihood, exploitability, and business effects; then prioritize controls and consider the risk that remains. A consistent methodology, such as NIST 800-30, supports comparable assessments. section 6.3 section 6.3.1
A high vulnerability-severity score is not automatically a high business risk. CVSS alone does not capture exploitability or business effects. EPSS, threat intelligence, business impact analysis, and existing controls help distinguish an exposed, important system from a less consequential one. Record resulting actions in a risk register or Plan of Action and Milestones, including who must act and by when; review open, closed, and overdue risks over time. section 6.3.2 section 5.3.2
Reading an assessment dashboard
A medical-technology provider compared vulnerability counts and incident-response measures before and after a risk management program. Its targets included fewer than 25 high vulnerabilities, detection within 6 hours, and containment within 1 hour. Results improved, but 20 high vulnerabilities still called for prioritized action. The useful conclusion is both a measured improvement and a specific remaining workload—not a claim that risk has disappeared. section 6.3.3
Figure 6.6 On the left, the TechMed risk assessment dashboard before the risk management program is implemented. In this figure, the bottom metrics are displayed as a percentage to indicate the percentage of incidents that were within the predefined target of hours. For example, 40% of the incidents were detected within the 12-hour target detection time. On the right, the risk assessment dashboard after implementing the risk management program.
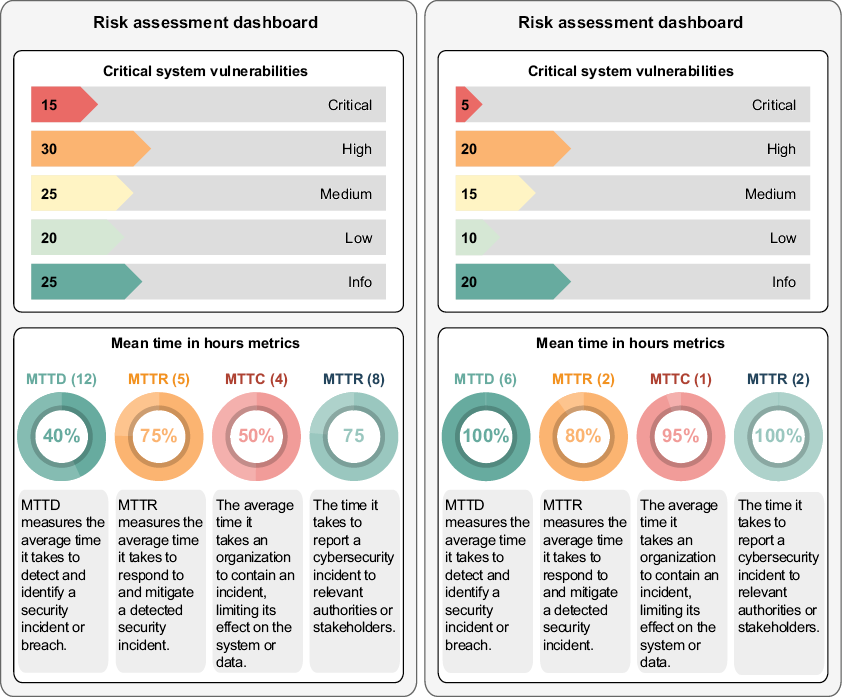
Compare the before-and-after dashboard, including vulnerability counts and the share of incidents meeting response-time targets. section 6.3.3



